- Title
-
Dual topologies of myotomal collagen XV and Tenascin C act in concert to guide and shape developing motor axons
- Authors
- Nemoz-Billet, L., Balland, M., Gilquin, L., Gillet, B., Stévant, I., Guillon, E., Hughes, S., Carpentier, G., Vaganay, E., Sohm, F., Misiak, V., Gonzalez-Melo, M.J., Koch, M., Ghavi-Helm, Y., Bretaud, S., Ruggiero, F.
- Source
- Full text @ Proc. Natl. Acad. Sci. USA
|
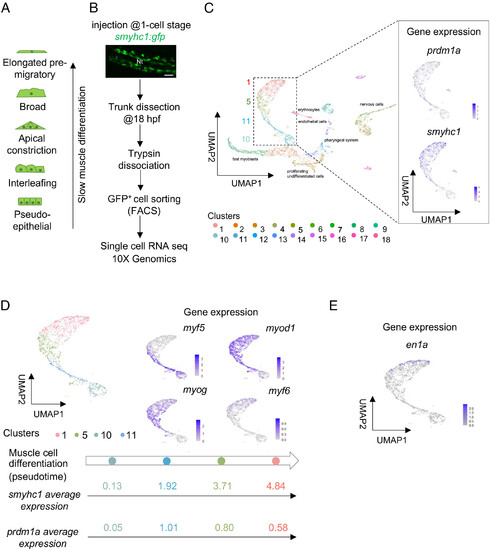
Differentiating SMPs display specific gene expression signatures. (A) Schematics of the morphological series of differentiating SMPs in 18 hpf embryos. (B) Schematic representation of the protocol used for scRNAseq; Confocal projection of smyhc1:gfp expression in a living 18 hpf embryo. Dorsal view. (Scale bar, 50 µm.) Nt, notochord. Anterior is left. (C) UMAP plot obtained after mapping on the zebrafish genome and clusterization of isolated GFP+ cells (Left panel); UMAP feature plots showing expression patterns of slow muscle lineage markers prdm1a and smyhc1 (Right panel). (D) UMAP plot obtained after isolation of the clusters corresponding to SMP lineage; UMAP feature plots showing the expression pattern of myogenic regulatory factors in differentiating SMPs (Right panel); pseudotime trajectory of differentiating SMPs; smyhc1 and prdm1a average expression in each cluster (Bottom panel). Colors represent different clusters. (E) UMAP feature plot showing the expression of the MP marker en1a. |
|
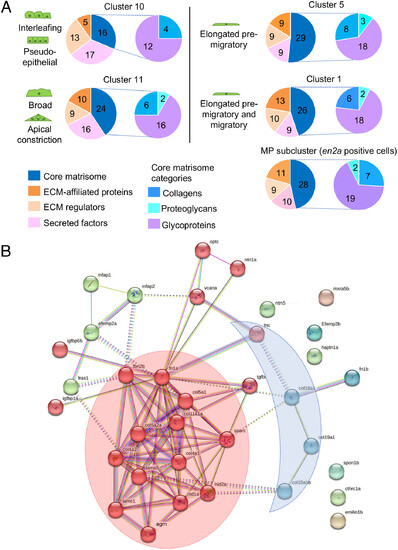
Characterization of differentiating SMP matrisomes. (A) Left pie charts represent the number of matrisome genes expressed in each cluster and classified by categories, Right pie charts represent the number of core-matrisome genes expressed in each cluster and by subcategories. (B) Protein?protein interaction network analysis of the total core matrisome genes expressed by SMPs with STRING database. The protein interaction network of the 36 core-matrisome genes was created with an enrichment P-value <10?16. Clusters were generated using a MCL inflation parameter of 2. One color represents one cluster. Two hubs of interest are highlighted: BM-toolkit (red) and BM-associated genes (blue). |
|
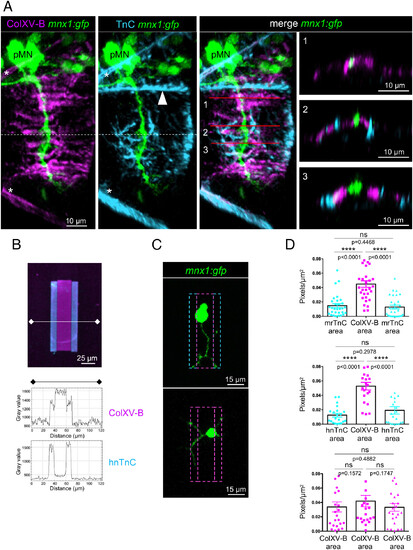
The motor axon trajectory is formed by a central ColXV-B path delimited by TnC borders. (A) 3D Imaris images of whole-mount immunostaining of 27 hpf mnx1:gfp embryos with anti-rNC1 (magenta, ColXV-B), anti-TnC (cyan), and anti-GFP antibodies (green, motor neurons). Left panel, lateral views; Right panel, orthogonal views; anterior is left. The dotted line shows the horizontal myosepta. Asterisks indicate the vertical myosepta. The arrowhead points to the dorsal edge of the notochord. Numbers indicate the level of virtual orthogonal sections (B) Double immunostaining of 45 × 70 µm ColXV-B/TnC micropatterns with anti-rNC1 (magenta, ColXV-B) and anti-TnC (cyan), plot profile of ColXV-B and TnC staining (Fiji software). Micropattern with human native TnC (hnTnC) is shown. (C) Live confocal images of motor neurons 24 h after seeding on 31 × 70 µm ColXV-B/TnC micropatterns (Top panel) and ColXV-B control micropatterns (Bottom panel). (D) Quantification of the number of pixels corresponding to the neurites for each ColXV-B or TnC area expressed in percentage of the total micropattern area. Top panel, double ColXV-B/murine recombinant TnC (mrTnC) micropatterns; n = 30; Middle panel, ColXV-B/ hnTnC double micropatterns, n = 21; Bottom panel, ColXV-B control micropatterns, n = 23. Statistical analysis was performed using one-way ANOVA and Tukey?s multiple comparisons tests. ****P < 0.0001; ns, not significant. Error bars are mean ± SEM. |
|
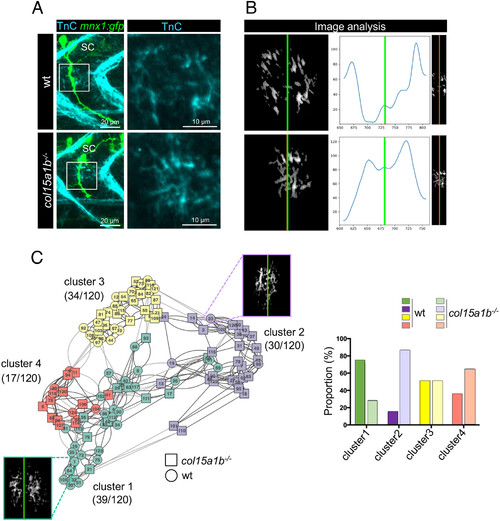
Lack of ColXV-B compromises TnC channel-like organization in the motor axon path. (A) Left panel, whole-mount immunostaining of 27 hpf mnx1:gfp and col15a1b?/?;mnx1:gfp embryos with anti-TnC (cyan) and anti-GFP (green, motor axons) antibodies. Right panel, zoom of boxed images (Left) showing detail of Tnc staining. (B) Three-plot representation of one wild type and col15a1b?/?embryo. Left panel, 8-bit image resulting from the TnC deposition assessment. Right panel, 8-bit image resulting from the truncation step for TnC channel organization analysis. Curves show TnC distribution along the motor path (blue curve) estimated by vertically summing nonzero pixels then smoothed by a Gaussian filter. In all images, the green line marks the center of the TnC channel. nwt = 11 embryos, ncol15a1b?/? = 13 embryos, for each embryo 5 axons are analyzed. (C) Left panel, Clustering analysis of 120 images of TnC staining in wt (circle) and col15a1b?/? (square) mutants. One color represents one cluster and numbers in brackets indicate the total number of images for each cluster out of the 120 images analyzed. Representative eight-bit image is shown for cluster 1 (green) and cluster 2 (mauve). Right panel, Histogram showing the proportion of wt and col15a1b?/? mutant embryos in each cluster; For a same color, dark color represents wt embryos and light color represents col15a1b?/? embryos. |
|
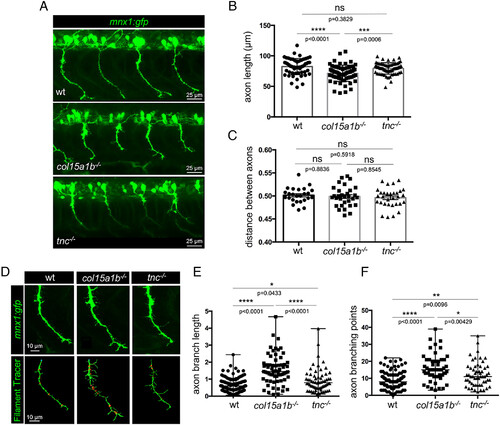
col15a1b?/? and tnc?/? embryos both display abnormal extrabranching phenotype. (A) whole-mount immunofluorescence of 27 hpf wild-type, col15a1b?/?, and tnc?/? mutant embryos with gfp antibodies (motor neurons, green). (B) Quantification of the axon length, nwt = 11 embryos, 55 axons, ncol15a1b?/? = 13 embryos, 65 axons, ntnc?/? = 13 embryos, 64 axons; (C) Distance between axons normalized to the distance between the two adjacent somites (in µm), nwt = 9 embryos, 25 somites, ncol15a1b?/? = 10 embryos, 31 somites, ntnc?/? = 10 embryos, 31 somites. Statistical analyses in B and C were performed using Tukey?s multiple comparisons test. Mean and SD are presented. (D) Whole-mount immunostaining of 27 hpf wt, tnc?/? and col15a1b?/? mutant embryos with anti-GFP to visualize individual motor axons (green) and their corresponding 3D representation using filament tracer (Imaris software). (E) Quantification of branching length normalized to axon length, nwt = 24 embryos, 118 axons, ncol15a1b?/? = 13 embryos, 64 axons, ntnc?/? = 13 embryos, 64 axons (F) branching point normalized to axon length, nwt = 21 embryos, 97 axons, ncol15a1b?/? = 13 embryos, 54 axons, ntnc?/? = 13 embryos, 56 axons. (E and F) Statistical analyses were performed using Kruskal?Wallis and Dunn?s multiple comparisons tests, median and range are represented. In all graphs, each point represents one motor axon. ns, not significant; *P < 0.05, **P < 0.01, ***P < 0.001, ****P < 0.0001. All embryos are lateral views; anterior is left. |
|
ColXV-B locally creates a soft microenvironment that elicits motor axon growth. (A) Confocal images of 27 hpf mnx1:gfp motor neurons cultivated on 5 or 40 kPa polyacrylamide hydrogels for 24 h. Zoomed images of the boxed areas are shown. (B) Left, initial image sample (Upper panel) and after image analysis using the customized version of ?Angiogenesis Analyzer?, ImageJ software (Bottom panel). Asterisks, motor neuron cell bodies; arrows indicate master segments (orange); neurite branch (green); master junction (red). Right, quantification of the total master segment length and total branch length per cell, 24 h after motor neurons seeding (n = 418 cells for 40 kPa gels; n = 803 cells for 5 kPa gels). Triplicates of three independent experiments are represented. Statistical analysis was performed using a Student?s t-test. Mean and SEM are presented. ***P < 0.001. (C) Elastic modulus in the motor axon path obtained from cryosections of 27 hpf wt, col15a1b?/? and shh-injected embryos in mnx1:gfp background. Statistical analysis was performed using Kruskal?Wallis and pairwise Wilcoxon multiple comparisons tests. *P < 0.05. nwt = 1,342, ncol15a1b?/? = 690, nshh-injected = 400. Data are mean ± SEM |

