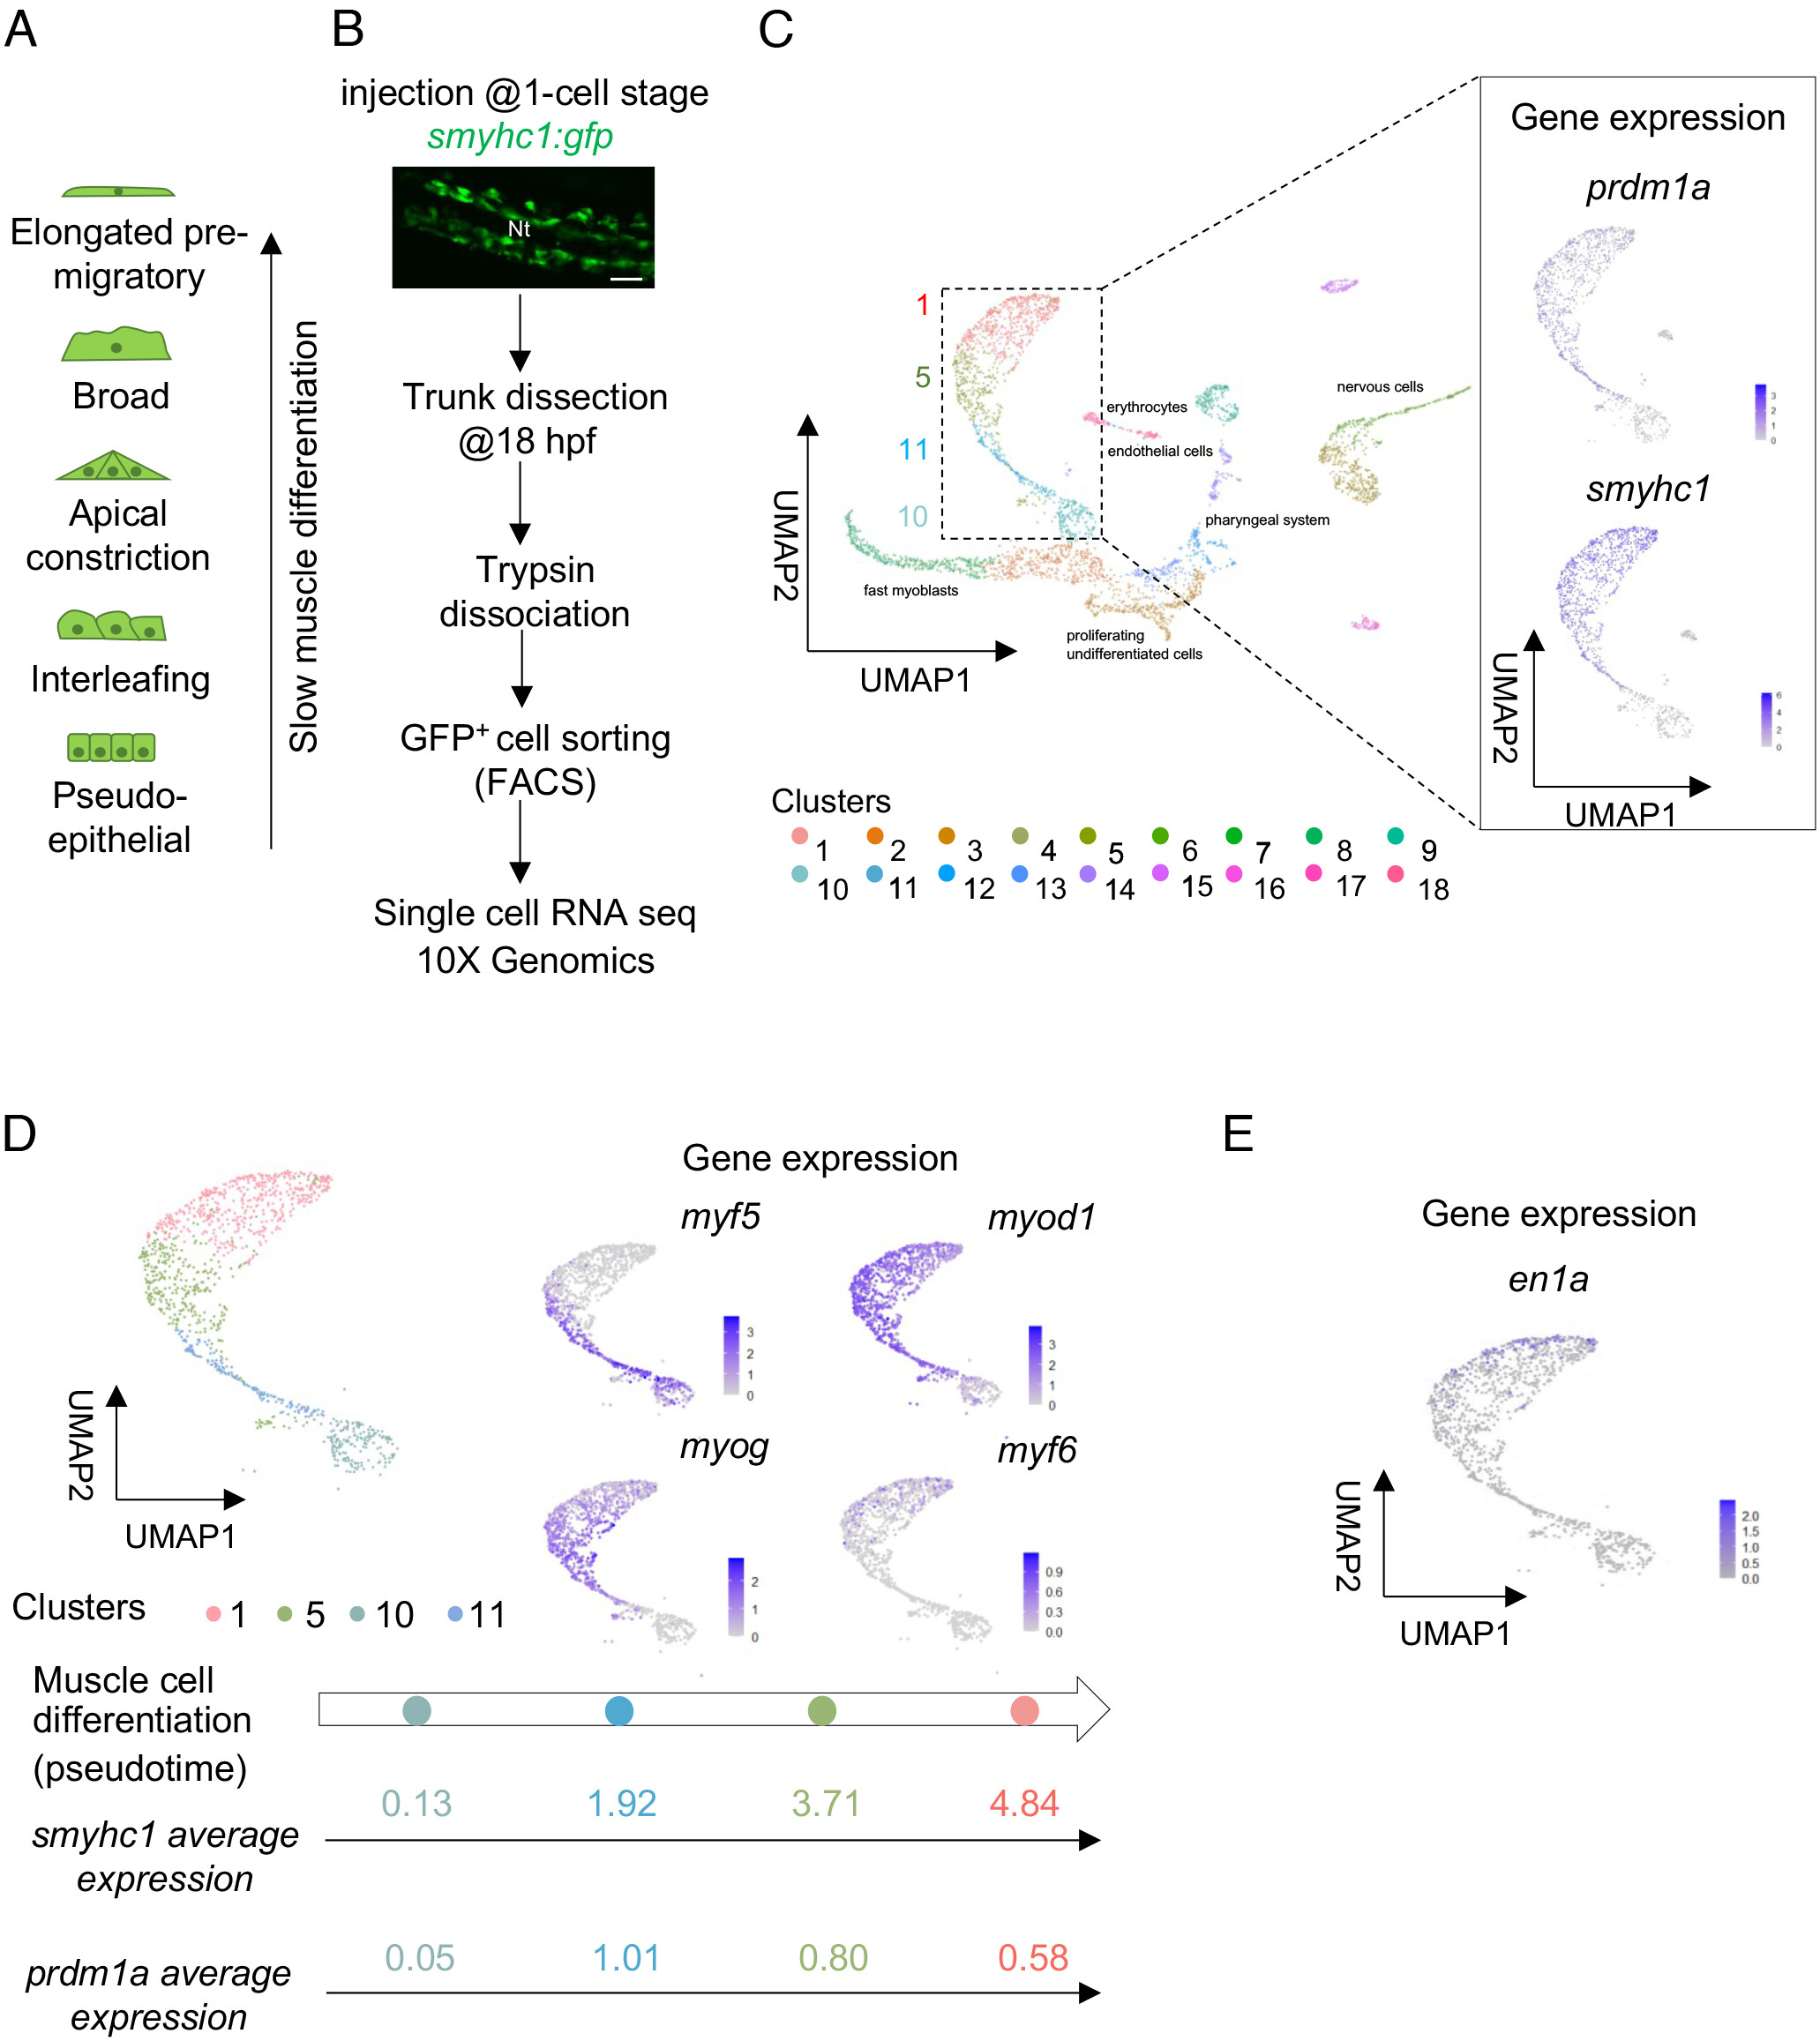
Fig. 1 Differentiating SMPs display specific gene expression signatures. (A) Schematics of the morphological series of differentiating SMPs in 18 hpf embryos. (B) Schematic representation of the protocol used for scRNAseq; Confocal projection of smyhc1:gfp expression in a living 18 hpf embryo. Dorsal view. (Scale bar, 50 Ám.) Nt, notochord. Anterior is left. (C) UMAP plot obtained after mapping on the zebrafish genome and clusterization of isolated GFP+ cells (Left panel); UMAP feature plots showing expression patterns of slow muscle lineage markers prdm1a and smyhc1 (Right panel). (D) UMAP plot obtained after isolation of the clusters corresponding to SMP lineage; UMAP feature plots showing the expression pattern of myogenic regulatory factors in differentiating SMPs (Right panel); pseudotime trajectory of differentiating SMPs; smyhc1 and prdm1a average expression in each cluster (Bottom panel). Colors represent different clusters. (E) UMAP feature plot showing the expression of the MP marker en1a.
Image
Figure Caption
Acknowledgments
This image is the copyrighted work of the attributed author or publisher, and
ZFIN has permission only to display this image to its users.
Additional permissions should be obtained from the applicable author or publisher of the image.
Full text @ Proc. Natl. Acad. Sci. USA

