FIGURE SUMMARY
Title

A single base pair substitution in zebrafish distinguishes between innate and acute startle behavior regulation

Authors
Ortiz, E.A., Campbell, P.D., Nelson, J.C., Granato, M.
Source
Full text @ PLoS One

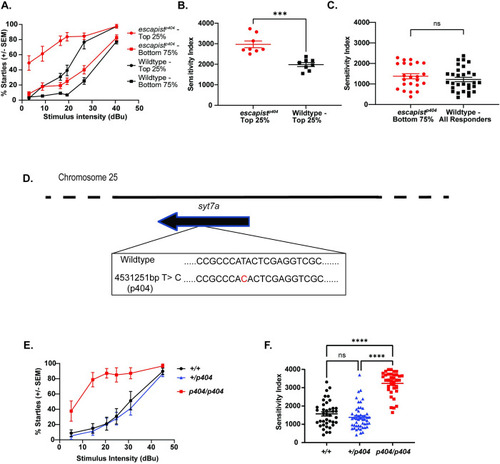
RNA sequencing linkage analysis identifies a single base pair change on Chromosome 25 that is tightly linked to the escapist hypersensitive phenotype.

(A) Acoustic sensitivity curve for escapist and wildtype (WIK) 5-day old larval zebrafish. X-axis represents stimulus intensity (dBu) and Y-axis represents percent short latency (SLC) startles. Larvae were placed in the following groups: the top 25% responsive larvae from the escapist line (escapist- Top 25%, n = 8 larvae), the bottom 75% responsive larvae from the escapist line (escapist -Bottom 75%, n = 23 larvae), the top 25% responsive larvae from the wildtype WIK line (Wildtype- Top 25%, n = 8 larvae), the bottom 75% responsive larvae from the wildtype WIK line (Wildtype- Bottom 75%, n = 22 larvae). (B) The area under the sensitivity curve was computed to generate the sensitivity index for each individual larva represented in Fig 1A. Sensitivity index for the top 25% responders from the escapist line (red circles) and wildtype WIK lines (black squares). Unpaired t-test for escapist Top 25% vs wildtype Top 25%: p = 0.0001. (C) Sensitivity index for the bottom 75% escapist responders (red circles) and all responders from the wildtype WIK lines (black squares). Unpaired t-test for escapist Bottom 75% vs wildtype All responders: p = 0.3380 (ns). (D) Schematic of linked region on Chromosome 25 identified through RNA Sequencing linkage analysis using zv9 as a reference genome. Analysis of linked mutations identified one single nucleotide base pair change (chr25:4531251bp T->C or p404) as highly linked to the escapist hypersensitive phenotype. Sequence shown is of the reverse strand. (E) Acoustic sensitivity curve for 5dpf larvae from crosses of escapist carriers genotyped for the p404 lesion. Homozygous wildtype (+/+, n = 39 larvae) curve shown in black, heterozygous (+/p404, n = 50 larvae) shown in blue, homozygous mutant (p404/ p404, n = 36 larvae) shown in red. (F) Sensitivity index for escapist line sensitivity curves shown in 1E using p404 for genotyping. Kruskal-Wallis test performed with Dunn’s test for multiple comparisons. WT vs. Mut: p<0.0001; Het vs Mut: p<0.0001; WT vs Het: p = 0.8723.

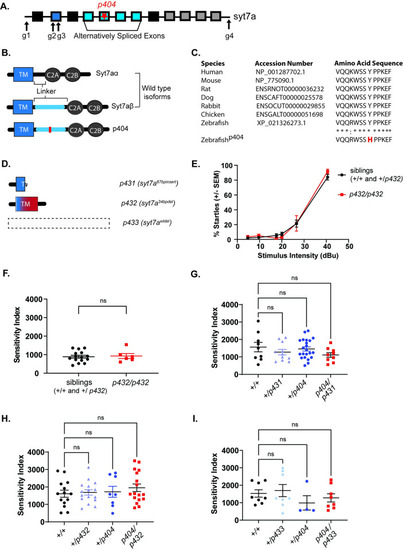
CRISPR-Cas9 generated syt7a mutant alleles complement the escapist p404 mutation.

(A) Schematic of syt7a gene. Boxes indicate exons. Exon 2 (dark blue) encodes the transmembrane region of the Syt7a protein. Exons 4–7 are alternatively spliced to produce linker domains of varying lengths. The last four exons encode for the two calcium binding domains, C2A and C2B. Star represents the location of the p404 lesion within the syt7a gene. Arrows indicate regions that were targeted with CRISPR guides for generation of independent mutant alleles. (B) Schematic illustrating the protein structures of two syt7a splicing isoforms: syt7aα and syt7aβ as well as the protein structure resulting from the p404 base pair change within the escapist line. The red line indicates where the missense mutation is located within the syt7aβ isoform. (C) Clustal Omega alignment of the Syt7β protein isoform across different vertebrates. Asterisks (*) represent amino acids that are fully conserved across vertebrates, whereas colons (:) represent amino acids that are similar. Zebrafishp404 results in an amino acid change of a highly conserved Tyrosine (Y) to a Histidine (H) in the syt7aβ isoform. (D) Depiction of predicted protein structures from CRISPR-Cas9-generated syt7a mutant lines. syt7a67bpinsert(p431) and syt7a34bpdel(p432) encode premature stops resulting in a predicted truncated protein of both wildtype isoforms of syt7a. The entire syt7a locus is deleted in syt7awldel(p433), which is predicted to produce no protein in the resulting mutant line. (E) Sensitivity curve for both siblings (n = 15 larvae, black line) and p432 homozygous mutant larvae (n = 6 larvae, red line). X-axis represents the stimulus intensity presented to larvae; Y-axis represents the average percent startles performed by larvae in each group. (F) The area under the curve calculated from the sensitivity curve of both siblings and p432 homozygous mutant individual larvae and plotted as the sensitivity index (AU). Mann-Whitney test was used to compare siblings to p432 mutants (p = 0.9257). (G) Sensitivity Index for complementation testing between escapist line and syt7a67bpinsert(p431) allele. Homozygous WT (+/+, n = 9 larvae), +/p431 (n = 10 larvae), +/p404 (n = 22 larvae), p404 / p431 (n = 9 larvae). Groups were compared by using a one-way ANOVA with Tukey’s test for multiple comparisons. (H) Sensitivity Index for complementation testing between escapist line and syt7a34bpdel(p432) allele. Homozygous WT (+/+, n = 14 larvae), +/p432 (n = 16 larvae), +/p404 (n = 8 larvae), p404 /p432 (n = 17 larvae) Groups were compared by using a one-way ANOVA with Tukey’s test for multiple comparisons. (I) Sensitivity Index for complementation testing between escapist line and syt7awldel(p433) allele. Homozygous WT (+/+, n = 8 larvae), +/p433 (n = 8 larvae), +/ p404 (n = 4 larvae), p404 /p433 (n = 8 larvae). Groups were compared by using a Kruskal-Wallis test with Dunn’s test for multiple comparisons.

syt7a mutant larvae do not exhibit altered behavioral phenotype at 6 days post fertilization.

(A) Acoustic startle short term habituation assay. i) Percent startle of both siblings (n = 20 larvae, black) and p432 homozygous mutant larvae (n = 9 larvae, red) at baseline (10 acoustic stimuli with 40 sec interstimulus interval), as well as during stimuli that induce habituation (acoustic stimulus presented with 1sec interstimulus interval). Average percent startle is reported for stimulus number 1–10, 11–20, 21–30. Any larvae that had an average probability of startle of less than 60% during baseline stimuli were omitted from habituation analysis. ii) Habituation index calculated for both siblings and p432 homozygous mutant larvae. Habituation index is calculated using the following formula: % Habituation = [1- ((%Startle Stimulus 21–30)/ (%Startle Baseline))] *100. Mann-Whitney test was used to compare siblings to p432 mutants (p = 0.7871). (B) Analysis of dark flash response for sibling larvae (n = 74 larvae) and p432 homozygous mutant larvae (n = 20 larvae). i) O-bend probability, ii) average O-bend latency and iii) average distance traveled during O-bend are shown. For statistical purposes, values were normalized to sibling responses, and student’s t-test was performed to compare mutants and sibling groups with Bonferroni for multiple comparisons of 86 parameters analyzed during behavioral testing (See S2 Fig for all parameters tested).

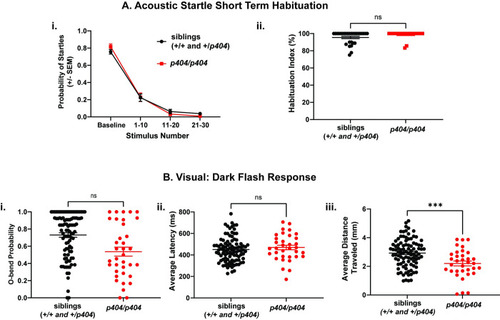
escapist p404 larvae exhibit increased acoustic startle sensitivity and decreased visual responses at 6 days post fertilization.

(A) Acoustic startle short term habituation assay: i) Average probability of startle for siblings (n = 29 larvae, black) and p404 homozygous mutant larvae (n = 23 larvae, red) in escapist line at baseline (10 acoustic stimuli with 40 sec interstimulus interval), as well as during stimuli that induce habituation (acoustic stimulus presented with 1sec interstimulus interval). Average probability of startle is grouped by stimulus number 1–10, 11–20, 21–30. Any larvae that had an average probability of startle of less than 0.6 during baseline stimuli were omitted from habituation analysis. ii) Habituation index calculated for both siblings and p404 homozygous mutant larvae. Habituation index is calculated using the following formula: % Habituation = [1- ((%Startle Stimulus 21–30)/ (%Startle Baseline))] *100. (B) Dark flash response for sibling larvae (n = 95 larvae) and p404 homozygous mutant larvae (n = 34 larvae). i) O-bend probability, ii) average distance traveled and iii) average distance traveled are shown. For statistical purposes, values were normalized to sibling responses, and student’s t-test was performed to compare mutants and sibling groups with Bonferroni used for multiple comparisons of 86 parameters analyzed during behavioral testing (See S2 Fig for all parameters tested). P-values that are significant after analysis and statistical correction are indicated with asterisks (***).

Acknowledgments
This image is the copyrighted work of the attributed author or publisher, and ZFIN has permission only to display this image to its users. Additional permissions should be obtained from the applicable author or publisher of the image. Full text @ PLoS One