- Title
-
Diethylhexyl phthalate exposure amplifies oxidant and inflammatory response in fetal hyperglycemia model predisposing insulin resistance in zebrafish embryos
- Authors
- Kaplan, G., Beler, M., Ünal, I., Karagöz, A., E?ilmezer, G., Üstünda?, Ü.V., Cans?z, D., Alturfan, A.A., Emekli-Alturfan, E.
- Source
- Full text @ Toxicol. Ind. Health
|
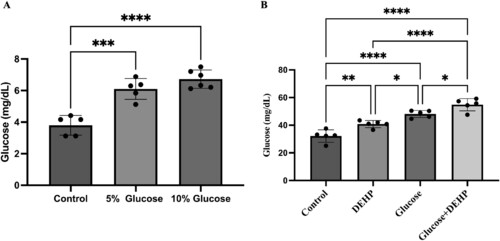
(a) Glucose levels (mg/dL) of the Control, 5% Glucose, and 10% Glucose treated embryos and (b) Glucose levels (mg/dL) of the Control, DEHP, Glucose, and Glucose + DEHP treated embryos. Data are expressed as mean ± SD from the three independent experiments (n = 3, 3 biological replicates for each group, 50 embryos/pool). *p < 0.05; **p < 0.01; ***p < 0.001; ****p < 0.0001, DEHP: Bis(2-ethylhexyl) phthalate, SD: standard deviation |
|
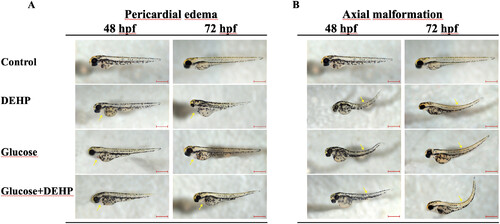
Representative images of the zebrafish embryos in the groups at 48 hpf and 72 hpf. Pericardial edema (a) and axial malformations (b) were observed in the exposure groups indicating developmental defects. DEHP: Bis(2-ethylhexyl) phthalate. PHENOTYPE:
|
|
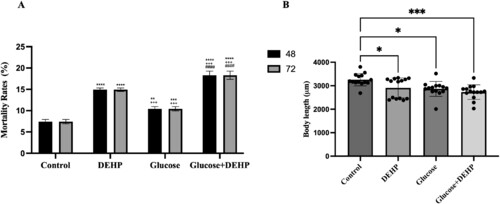
(a) Comparison of the mortality rates of the groups at 48 hpf and 72 hpf. ****p < 0.0001; **p < 0.01 significant different from the Control group; +++ p < 0.001 significant different from the Glucose group; ++++ p < 0.0001 significant different from the DEHP group (b) Body lengths of the groups. Data are expressed as mean ± SD (n = 15). *p < 0.05; **p < 0.01; ***p < 0.001; ****p < 0.0001; SD: standard deviation; DEHP: Bis(2-ethylhexyl) phthalate. PHENOTYPE:
|
|
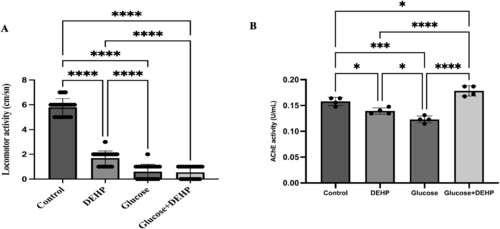
(a) Comparison of the locomotor activities of the groups. Data are expressed as mean ± SD (n = 20). (b) Acetylcholinesterase activities of the groups. Data are expressed as mean ± SD from the three independent experiments (n = 3, 3 biological replicates for each group, 50 embryos/pool); *p < 0.05; **p < 0.01; ***p < 0.001; ****p < 0.0001; SD: standard deviation; DEHP: Bis(2-ethylhexyl) phthalate. PHENOTYPE:
|
|
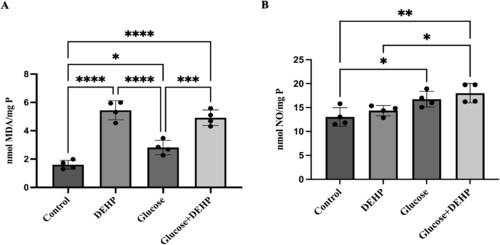
(a) Comparison of the lipid peroxidation (LPO) levels of the groups. (b) Nitric oxide levels of the groups. Data are expressed as mean ± SD from the three independent experiments (n = 3, 3 biological replicates for each group, 50 embryos/pool); *p < 0.05; **p < 0.01; ***p < 0.001; ****p < 0.0001; SD: standard deviation; DEHP: Bis(2-ethylhexyl) phthalate. PHENOTYPE:
|
|
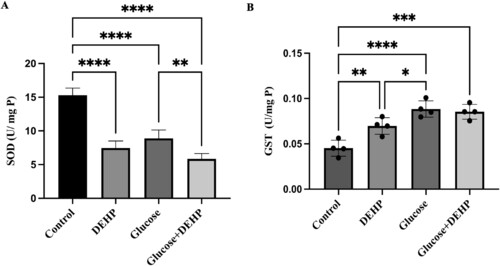
(a) Comparison of the superoxide dismutase (SOD) activities of the groups. (b) Comparison of the glutathione S-transferase activities of the groups Data are expressed as mean ± SD from the three independent experiments (n = 3, 3 biological replicates for each group, 50 embryos/pool); *p < 0.05; **p < 0.01; ***p < 0.001; ****p < 0.0001; SD: standard deviation; DEHP: Bis(2-ethylhexyl) phthalate. PHENOTYPE:
|
|
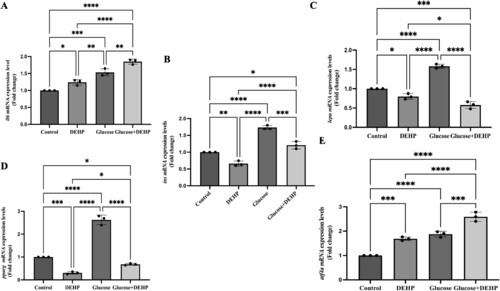
Presentation in a bar graph of the fold change of the RT-PCR-quantified transcripts of (A) il6, (B) ins, (C) lepa, and (D) pparg. All RT-PCR results are expressed as changes from their respective controls after being normalized to the housekeeping gene beta-actin. Three studies (n = 3, 3 biological replicates for each group, 50 embryos/pool) were used to calculate the average values. Data presented are mean ± SD. *p < 0.05; **p < 0.01; ***p < 0.001; ****p < 0.0001 SD: standard deviation. EXPRESSION / LABELING:
PHENOTYPE:
|

