
IMAGE
Fig. 7
Image
|
Figure Caption
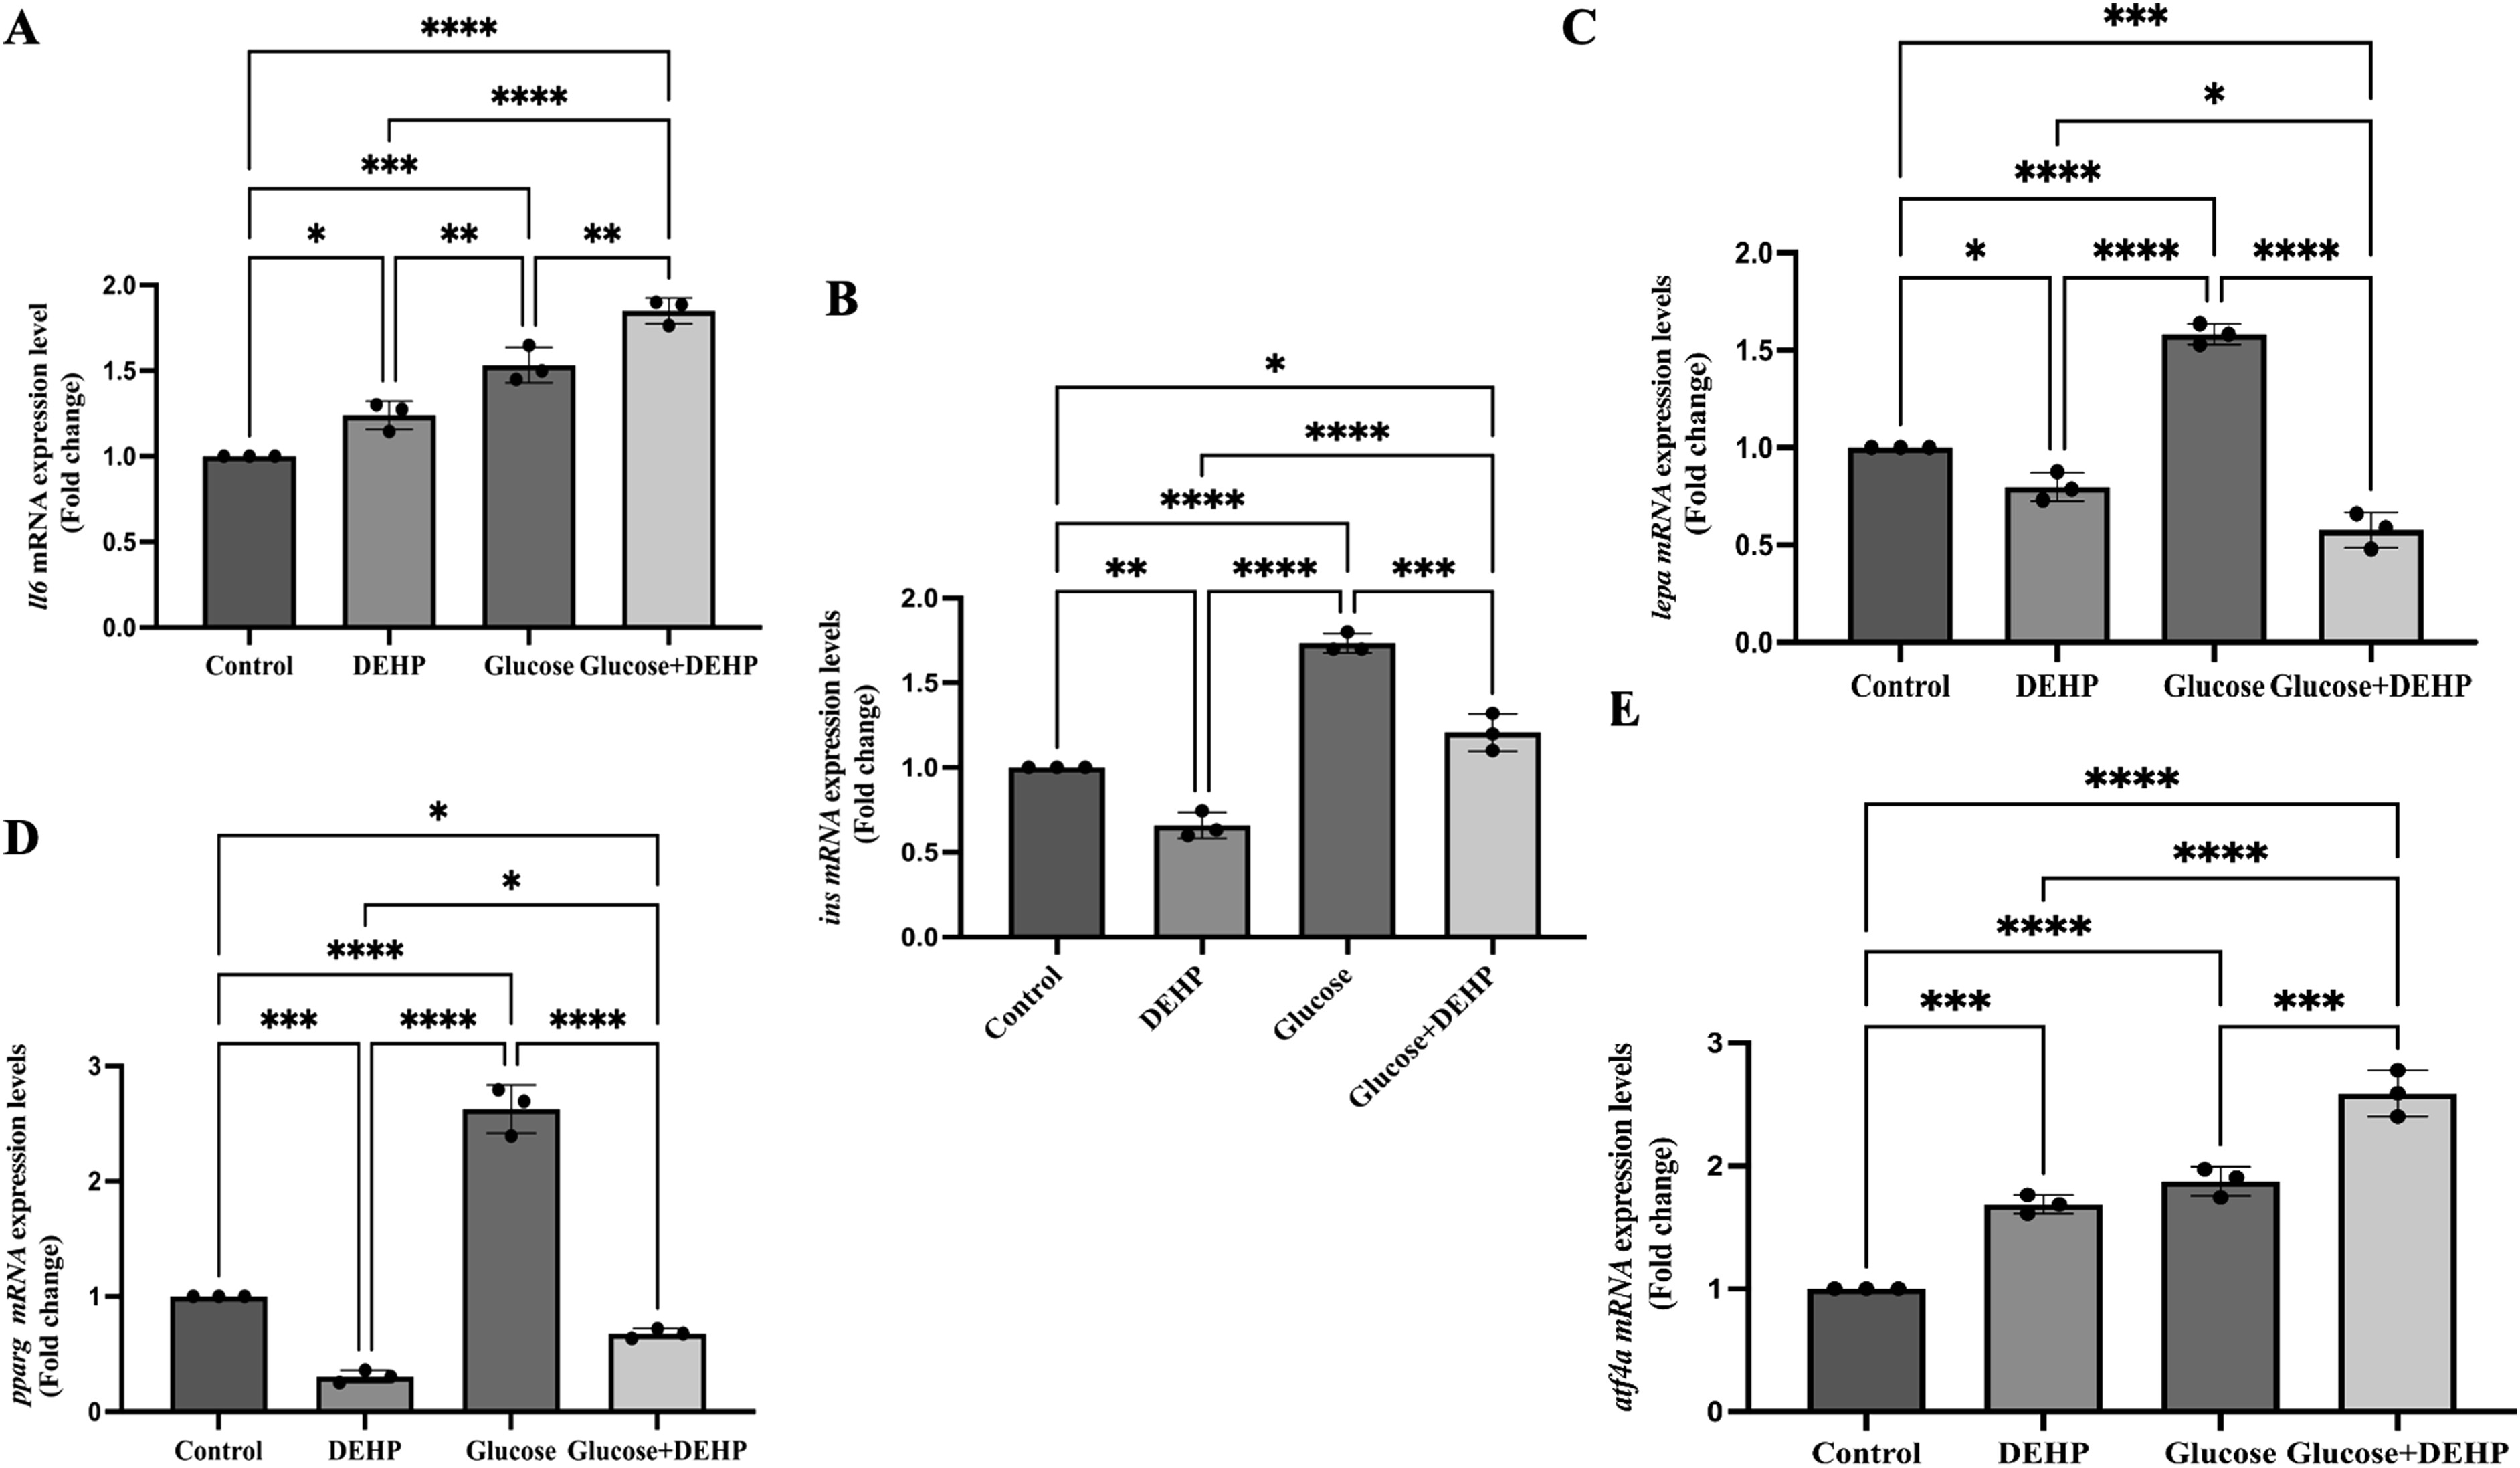
Fig. 7 Presentation in a bar graph of the fold change of the RT-PCR-quantified transcripts of (A) il6, (B) ins, (C) lepa, and (D) pparg. All RT-PCR results are expressed as changes from their respective controls after being normalized to the housekeeping gene beta-actin. Three studies (n = 3, 3 biological replicates for each group, 50 embryos/pool) were used to calculate the average values. Data presented are mean � SD. *p < 0.05; **p < 0.01; ***p < 0.001; ****p < 0.0001 SD: standard deviation.
Figure Data
Acknowledgments
This image is the copyrighted work of the attributed author or publisher, and
ZFIN has permission only to display this image to its users.
Additional permissions should be obtained from the applicable author or publisher of the image.
Full text @ Toxicol. Ind. Health