FIGURE SUMMARY
Title

Nomo1 deficiency causes autism-like behavior in zebrafish

Authors
Zhang, Q., Li, F., Li, T., Lin, J., Jian, J., Zhang, Y., Chen, X., Liu, T., Gou, S., Zhang, Y., Liu, X., Ji, Y., Wang, X., Li, Q.
Source
Full text @ EMBO Rep.

ZFIN is incorporating published figure images and captions as part of an ongoing project. Figures from some publications have not yet been curated, or are not available for display because of copyright restrictions.

ZFIN is incorporating published figure images and captions as part of an ongoing project. Figures from some publications have not yet been curated, or are not available for display because of copyright restrictions.

ZFIN is incorporating published figure images and captions as part of an ongoing project. Figures from some publications have not yet been curated, or are not available for display because of copyright restrictions.

The expression level of the nomo1 mRNA during development and generation of nomo1 mutant zebrafish.

(A) Relative nomo1 transcript levels at different developmental stages (biological replicates, n = 3). (B) Diagram of zebrafish nomo1 gene and mutation induced by CRISPR/Cas9, gray boxes indicate exons. Target site was on Exon 7 resulting in a 1-base deletion (shown in sequence). The mutation results in early termination of translation after exon 7, before the functional domain of Nomo1, EMC7-beta-sandw. (C) Reduced expression of nomo1 mRNA in the whole embryo at 48 hpf, heads at 14 dpf and brain tissues at 2 mpf of nomo1−/− zebrafish analyzed using RT-qPCR (biological replicates, n = 4). (D) Brain weight of nomo1+ /+ and nomo1−/− shows significant differences (biological replicates, n = 6, 20 brains for each replicate group). Scale bar = 1 mm. (E) Quantitative analysis of brain cells or tissues (biological replicates, n = 6). (F) Brains of nomo1−/− exhibit relatively fragile brain tissue, arrows indicate tissue that collapses immediately after sectioning due to being too fragile. Red dashed circles indicate nucleus with abnormal neuronal development. Scale bar = 25 μm. Data information: Data are analyzed using unpaired t test and presented as the means ± SEM. *P < 0.05, **P < 0.01, ***P < 0.001, ****P < 0.0001. Source data are available online for this figure.

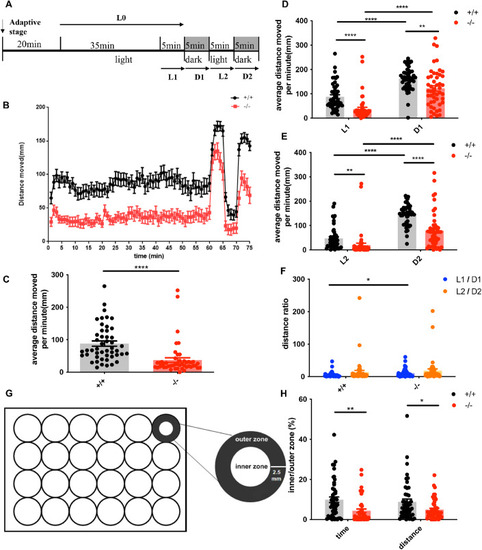
The locomotion and thigmotaxis behavior of 7-dpf WT and mutant zebrafish.

(A) Process of light/dark test of larval nomo1+/+ and nomo1/− zebrafish at 7 dpf. The whole experiment lasted for 75 min and consisted of 40 min of light (L0) and two 5-min light/dark cycles (L1-D1 and L2-D2). (B) Trend of total distance swum by larval zebrafish during the experiment. The horizontal axis is the swimming time, and the vertical axis is the distance moved to visualize the locomotion of zebrafish during the experiment (biological replicates, N = 48). (C) The average distance moved per minute under continuous illumination is shown (biological replicates, N = 48 per genotype). (D, E) The average distance moved per minute under two light/dark cycles (biological replicates, N = 48 per genotype). (F) Ratio of the distance moved by larval zebrafish during each light/dark cycle (biological replicates, N = 48 per genotype). (G) The inner and outer zones were delineated as shown in 24-well plate. The ratio of distance moved/time spent in the inner zone were to measure the frequency of thigmotaxis behavior. (H) The ratio of distance moved/time spent in the inner zone under light conditions (L0 period) in 7-dpf zebrafish larvae (N = 48). Data information: Data are analyzed using unpaired t test and presented as the means ± SEM, *P < 0.05, **P < 0.01, ****P < 0.0001. Source data are available online for this figure.

The locomotion of larval, juvenile, and adult WT and nomo1−/− zebrafish.

(A) Container of 15-dpf zebrafish in the open-field experiment. (BE) (C) Container of 30 dpf and 3-mpf zebrafish in the open-field experiment. (B,D, E) The locomotion of WT and mutant zebrafish over the total 30-min experimental period (biological replicates, N = 16 for each genotype at different developmental stages). (F) The average distance moved within each 1-min bin under continuous illumination is plotted (biological replicates, N = 16). Data information: Data are analyzed using unpaired t test and presented as the means ± SEM, *P < 0.05. Source data are available online for this figure.

nomo1−/− zebrafish displayed social deficiency and repetitive behaviors.

(AE) The social preference experiment with 2-mpf zebrafish. (A) Schematic diagram of the individual social behavior experiment. A heatmap (B, C) showing that nomo1−/− zebrafish spent significantly less time in the social area than WT zebrafish. The ratio of distance from the social area (D) and time spent in the social area (E) was significantly lower for nomo1−/− zebrafish than for WT zebrafish (biological replicates, N = 20). (F, G) Schematic of the shoaling test in which the interindividual distance exhibited by nomo1/− zebrafish was significantly higher than WT zebrafish (biological replicates, N = 4). (H, I) Schematic of different repetitive behaviors including “back-and-forth motions”, “small circling” and “big circling”. nomo1−/− zebrafish exhibited a significantly higher proportion of all kinds of repetitive behaviors (biological replicates, N = 16). Data information: Data are analyzed using unpaired t test and presented as the mean ± SEM, *P < 0.05. Source data are available online for this figure.

PHENOTYPE:
Fish:
Observed In:
Stage: Days 45-89

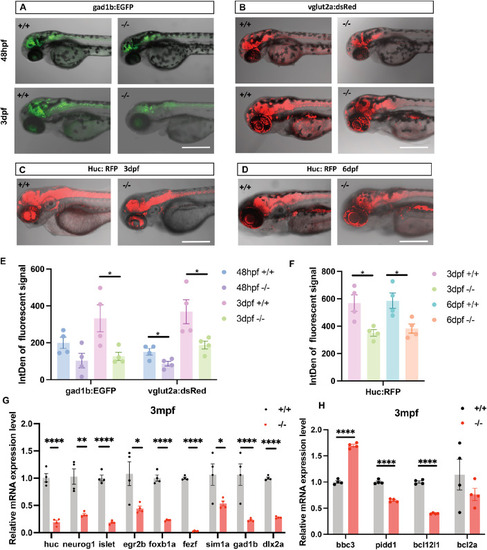
Loss-of-function of nomo1 affected neurodevelopment in larval zebrafish.

(A, B) EGFP labeled GABAergic inhibitory neurons and dsRed labeled glutamatergic excitatory neurons at 48 hpf and 3 dpf of WT and nomo1/−. Scale bar=1 mm. (C, D) RFP labeled neuro progenitors at 3 dpf and 6 dpf of WT and nomo1−/−. Scale bar=1 mm. (E, F) Quantitative analysis of fluorescent signal (biological replicates, n = 4). (G) The relative expression level of neurological genes in nomo1−/ brain at 3 mpf (N = 4 × 5 animals per group). (H) The relative expression level of apoptosis genes in nomo1−/− brain at 3 mpf (N = 4 × 5 animals per group). Data information: Data are analyzed using unpaired t test and presented as the means ± SEM. *P < 0.05 and **P < 0.01, ****P < 0.0001. Source data are available online for this figure.

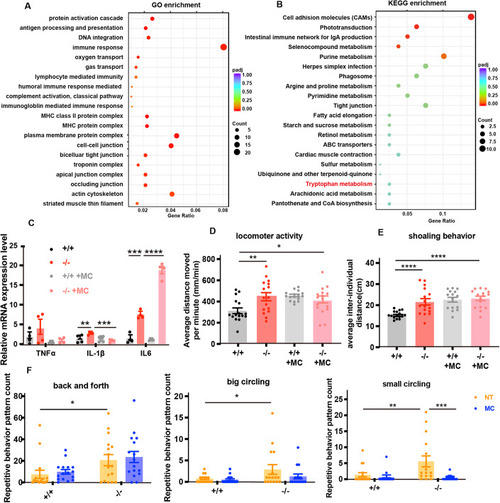
nomo1 mutant induce brain inflammatory in the brain, MC treatment rescued the small circling behavior.

(A) GO enrichment analysis of DEGs and (B) KEGG pathway analysis of DEGs. Advanced bubble chart showing the enrichment of DEGs in signaling pathways. The vertical axis indicates the pathway, and the horizontal axis indicates the gene ratio (gene ratio is the ratio of the number of DEGs to the total number of DEGs annotated to the KEGG pathway). The size and color of the bubble represent the number of DEGs enriched in a pathway and the significance of enrichment, respectively. (CF) (C) Relative expression level of inflammatory cytokines in WT, mutant and MT treatment brains (technical replicates, N = 4). Locomotor activity (D) biological replicates, N = 24), shoaling behavior (E) (biological replicates, N = 24) and three kinds of repetitive behaviors (F) (biological replicates, N = 24)) of WT, mutant and MC treatment zebrafish. NT was short for no treatment. Data are analyzed using unpaired t test and presented as the mean ± SEM, *P < 0.05, **P < 0.01, ***P < 0.001 and ****P < 0.0001. Source data are available online for this figure.

Melatonin treatment rescues overactive locomotor behavior and repetitive stereotypic behavior in nomo1−/−.

(A) Statistical analysis of the SRM/MRM data. The vertical axis denotes the normalized levels of neurotransmitters and metabolites (biological replicates, N = 3). (B) Statistical analysis of the HPLC data. The vertical axis denotes the levels of 4 neurotransmitters and metabolites in zebrafish brain (biological replicates, N = 8). (C) Melatonin levels of nomo1/ and nomo1+/+ (biological replicates, N = 3). (DF) Locomotor activity (D) (biological replicates, N = 24), shoaling behavior (E) (biological replicates, N = 24), and three kinds of repetitive behaviors (F) (biological replicates, N = 24) of WT, mutant and MT treatment zebrafish. NT was short for no treatment. Data are analyzed using unpaired t test and presented as the means ± SEM, *P < 0.05, **P < 0.01, ***P < 0.001 and ****P < 0.0001. Source data are available online for this figure.

Acknowledgments
This image is the copyrighted work of the attributed author or publisher, and ZFIN has permission only to display this image to its users. Additional permissions should be obtained from the applicable author or publisher of the image. Full text @ EMBO Rep.