
- Title
-
Circulating biomarkers in familial cerebral cavernous malformation
- Authors
- Lazzaroni, F., Meessen, J.M.T.A., Sun, Y., Lanfranconi, S., Scola, E., D'Alessandris, Q.G., Tassi, L., Carriero, M.R., Castori, M., Marino, S., Blanda, A., Nicolis, E.B., Novelli, D., Calabrese, R., Agnelli, N.M., Bottazzi, B., Leone, R., Mazzola, S., Besana, S., Catozzi, C., Nezi, L., Lampugnani, M.G., Malinverno, M., Grdseloff, N., Rödel, C.J., Rezai Jahromi, B., Bolli, N., Passamonti, F., Magnusson, P.U., Abdelilah-Seyfried, S., Dejana, E., Latini, R.
- Source
- Full text @ EBioMedicine

Workflow, sample information and expression of inflammatory proteins in fCCM patients (a) A schema depicting the workflow of this study. 71 fCCM patients were enroled in Treat_CCM clinical trial. In addition, 17 healthy subjects were enrolled. Selected biomarkers and circulating proteins of Inflammation and Cardiovascular III Olink biomarker panels were analysed. (b) Box and whisker plots (box represent the interquartile range and outliers are 1.5 box lengths rom median) of the concentrations of plasma biomarkers. Among the 17 plasma molecules (n = 3 technical replicates), fCCM patients showed upper plasma levels of CCL5, CRP, ICAM1, LBP, sCD14, THBS1 and a lower level of ANG2. fCCM are represented by red box, and HDs by green box. p-values were calculated by means of Kruskall–Wallis test and account for false discovery rate (FDR). CCL5, Chemokine (C–C motif) ligand 5; CRP, C reactive protein; ICAM1, intercellular adhesion molecule 1; LBP, lipopolysaccharide binding protein; sCD14, cluster of differentiation 14; THBS1, thrombospondin1; ANG2, angiopoietin2. (c) Colored heatmap of the pair-wise Spearman's rank correlation coefficients computed for circulating plasma molecules. The colors refer to the correlation coefficient direction and magnitude, ranging from −1 (blue) to 1 (red). |

Expression levels of biomarkers to stratify patients according to genotype. Box and whisker plots (box represent the interquartile range and outliers are 1.5 box lengths from median) of the concentrations of plasma CXCL4 (a), sENG (b) and THBS1 (c) markers for each fCCM genetic group (n = 3 technical replicates). The central black lines show the median values, regions above and below these lines show the upper and lower quartiles, respectively. CCM1 is represented by orange box, CCM2 by light red and CCM3 by dark red boxes. The p-values were calculated by means of Kruskall–Wallis test and account for false discovery rate. CXCL4, chemokine (C-X-C motif) ligand 4; sENG, soluble endogline; THBS1, thrombospondin1. |

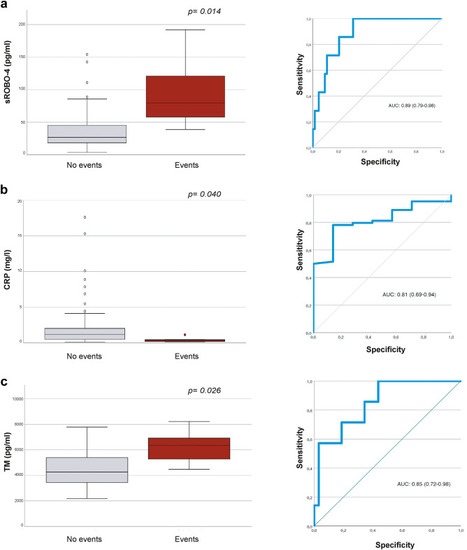
Plasma concentrations of sROBO4, TM and CRP by incident adverse clinical events and ROC curve analyses. Box and whisker plots (box represent the interquartile range and outliers are 1.5 box lengths from median) of the plasma concentrations of (a) sROBO4, (b) CRP and (c) TM in patients who had confirmed incident adverse CCM-related clinical events that occurred during the 2-years trial period (n = 3 technical replicates). The AUC ROC curve analyses of the differentiation between the participants who experienced clinical events versus patients without any clinical outcomes. The p-values were calculated by means of Kruskall Wallis test and account for false discovery rate (FDR). |
Plasma proteomic predictors of new MRI-detectable lesions. (a) Violin plot of normalized protein expression (NPX) of GDF-15 for patients with more than 5 new CCM-MRI lesions and less than 5 lesions over 2 years of trial period; and ROC curve analysis for predictive model using GDF-15 (derived from OLINK® cardiovascular panel) as a predictor to discriminate between patients with more than 5 new CCM-MRI lesions or less than 5 lesions over 2 years trial period. (b) Violin plot of normalized protein expression (NPX) of FLT3L, CXCL9, FGF-21 and CDCP1 for patients with more than 5 new CCM-MRI lesions and less than 5 lesions over 2 years of trial period. (c) ROC curve analysis for predictive CCM progression using a panel of predictors, FLT3L, CXCL9, FGF-21 and CDCP1 (derived from OLINK® inflammation panel) to discriminate between patients with more than 5 new CCM-MRI lesions or less than 5 lesions over 2 years trial period. |

ZFIN is incorporating published figure images and captions as part of an ongoing project. Figures from some publications have not yet been curated, or are not available for display because of copyright restrictions. EXPRESSION / LABELING:
PHENOTYPE:
|