
|
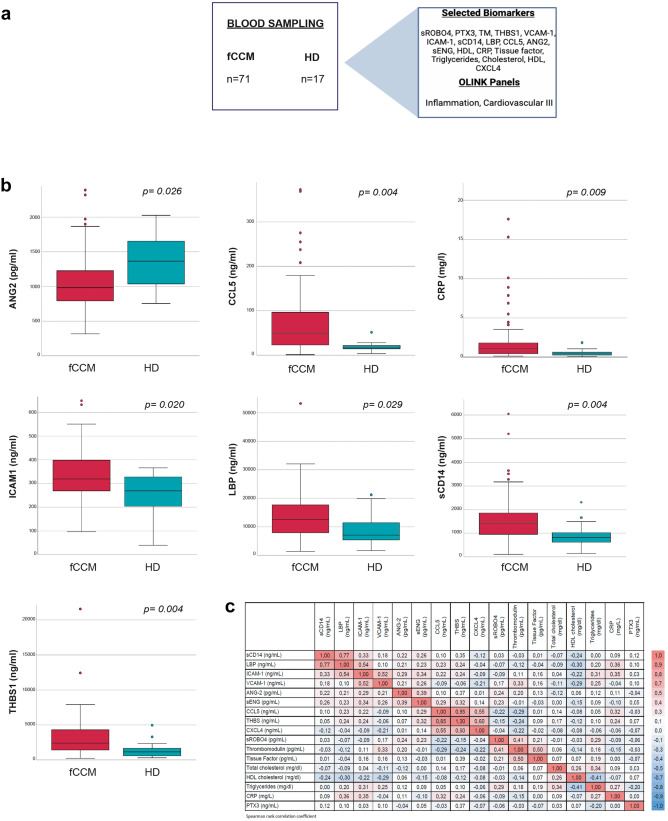
Fig. 1 Workflow, sample information and expression of inflammatory proteins in fCCM patients (a) A schema depicting the workflow of this study. 71 fCCM patients were enroled in Treat_CCM clinical trial. In addition, 17 healthy subjects were enrolled. Selected biomarkers and circulating proteins of Inflammation and Cardiovascular III Olink biomarker panels were analysed. (b) Box and whisker plots (box represent the interquartile range and outliers are 1.5 box lengths rom median) of the concentrations of plasma biomarkers. Among the 17 plasma molecules (n = 3 technical replicates), fCCM patients showed upper plasma levels of CCL5, CRP, ICAM1, LBP, sCD14, THBS1 and a lower level of ANG2. fCCM are represented by red box, and HDs by green box. p-values were calculated by means of Kruskall–Wallis test and account for false discovery rate (FDR). CCL5, Chemokine (C–C motif) ligand 5; CRP, C reactive protein; ICAM1, intercellular adhesion molecule 1; LBP, lipopolysaccharide binding protein; sCD14, cluster of differentiation 14; THBS1, thrombospondin1; ANG2, angiopoietin2. (c) Colored heatmap of the pair-wise Spearman's rank correlation coefficients computed for circulating plasma molecules. The colors refer to the correlation coefficient direction and magnitude, ranging from −1 (blue) to 1 (red).