FIGURE SUMMARY
Title

Intrinsic and extrinsic regulation of rhabdomyolysis susceptibility by Tango2

Authors
Kim, E.S., Casey, J.G., Tao, B.S., Mansur, A., Mathiyalagan, N., Wallace, E.D., Ehrmann, B.M., Gupta, V.A.
Source
Full text @ Dis. Model. Mech.

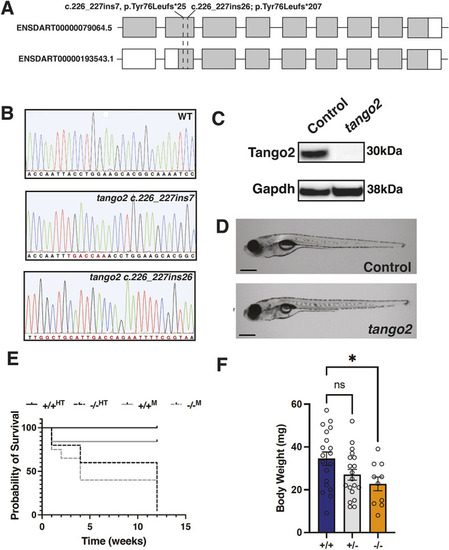
Tango2 deficiency results in growth defects and lethality. (A) Schematics depicting the position of tango2 alleles (tango2bwg210 and tango2bwg211) with reference to both transcripts in zebrafish. tango2 mutations resulted in insertions and frameshift mutations in different alleles. (B) Sanger sequencing for control and tango2 alleles depicting mutations in tango2bwg210 (c.226_227ins7) and tango2bwg211 (c.226_227ins26). (C) Western blot analysis of proteins from control and tango2 mutant fish (1 month of age). (D) Lateral view of control and tango2 mutant larval zebrafish showing no phenotypic differences. Images are representative of n=6 larval fish. Scale bar: 0.5 mm. (E) Kaplan–Meier survival curve of control (+/+HT) and tango2 mutants (−/−HT) obtained from heterozygous parents, and control (+/+M) and tango2 mutants (−/−M) obtained from wild-type and mutant parents, respectively. n=360. (F) Body weight analysis of control (+/+ and +/−) and tango2 mutants (−/−) at 1 month. n=60. Data are presented as mean±s.e.m. Unpaired two-tailed t-test, parametric; ns, not significant; *P<0.05.

EXPRESSION / LABELING:
Antibody:
Fish:
Anatomical Term:
Stage: Days 30-44

Tango2 is required for the structural organization of SR and mitochondria. (A) Myofibers were isolated from control (8-week-old) zebrafish and immunofluorescence for the SR (Ryr1), mitochondria (Tomm20) and the Golgi (Golga2) was performed. Single-channel densitometry tracing analysis of the longitudinal spatial profile was performed with colors corresponding to the staining pattern on the left, which showed that Tango2 localized with Ryr1 and Golga2. (B) Myofibers were isolated from control (8-week-old) and tango2 mutant zebrafish and immunofluorescence was performed. tango2−/− mutant myofibers showed areas with disorganized or reduced immunoreactivity for Ryr1 and Tomm20 antibodies (white arrows). Myofibers were isolated from three different zebrafish for each genotype, and 10-15 myofibers were analyzed by plot profile in ImageJ in each group. Scale bars: 10 µm. (C) Quantification of the myofibers with abnormal areas with reduced or no staining for Ryr1 and Tomm20 in control and tango2−/− zebrafish. Data represent mean±s.e.m. from three different samples and 45-65 myofibers. **P<0.01, unpaired two-tailed Student's t-test.

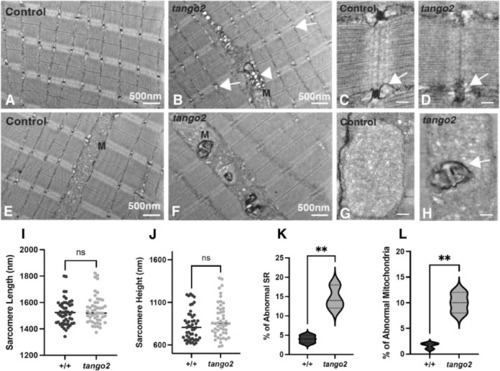
Tango2 deficiency results in abnormal SR and mitochondria in skeletal muscle. (A-H) Transmission electron microscopy images of the longitudinal sections of control and tango2 mutant larval fish (8 dpf). (A,B,I,J) No abnormalities were present in the sarcomeres in tango2 mutants (B) compared to controls (A). The SR in tango2 mutants exhibited small or collapsed SR (arrows, B). The tango2 mutant muscle also showed the presence of abnormal vesicular structures in the proximity of mitochondria (‘M’) and SR (white arrowhead, B). Quantification of the sarcomere length (I) and width (J) in control (+/+) and tango2 mutant sarcomeres showed no significant differences. (C,D,K) The enlarged panels show normal SR (arrow) in controls (C) on either side of the darkly stained t-tubule. In comparison, tango2 mutant SR (D) appears smaller or collapsed (arrow). Quantification of the abnormal SR (K) showed a significant increase in tango2 mutants compared to controls. (E,F) Mitochondria in the control muscle (E) exhibited normal organization of the inner and outer mitochondrial membranes. A number of myofibers in tango2 mutants (F) contained abnormal mitochondria with electron-dense whorled membrane structures. (G,H,L) Enlarged view of mitochondria in control myofibers (G) and tango2 mutant myofibers (H), which showed abnormal mitochondria with electron-dense whorled membrane structures (arrow, H). Quantification of the mitochondria (L) showed an increase in mitochondria with whorled membrane structures in the tango2 mutants. Data represent mean±s.e.m. from three different samples and 45-65 myofibers. ns, not significant; **P<0.01; two-tailed unpaired Student's t-test. Scale bars: 500 nm (A,B,E,F); 100 nm (C,D,G,H).

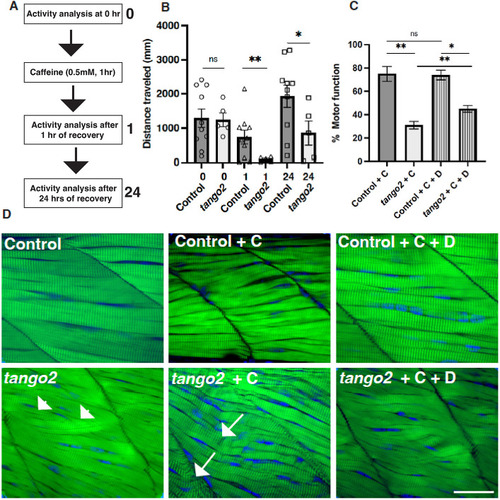
tango2 mutants exhibit increased sensitivity to caffeine-induced SR stress that is partially reversed by dantrolene. (A) Schematics for caffeine treatment. (B) Effect of caffeine treatment on total swimming distance by control and tango2 mutants. n=96. (C) Effect of dantrolene (‘D’) treatment on motor function in caffeine (‘C’)-treated control and tango2 mutants. Data were normalized to swimming distance before caffeine treatment within each group. n=48 in each group with 10-22 different genotypes. Data represent mean±s.e.m. Two-way ANOVA (mixed model) with multiple comparisons was performed between different groups. ns, not significant; *P<0.05, **P<0.01. (D) Whole-mount phalloidin staining (green) of control and tango2 mutants exposed to caffeine and dantrolene. Arrowheads indicate misaligned myofibers and arrows indicate damaged myofibers. Nuclei are shown in blue. Images are representative of n=6 larvae in each group. Scale bar: 5 µm.

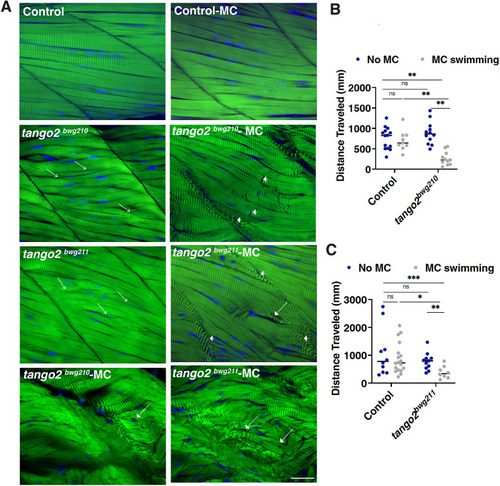
Exercise-induced skeletal muscle damage in Tango2 deficiency. (A) Whole-mount (green) phalloidin staining of control and tango2 mutants (tango2bwg210 and tango2bwg211) in the presence or absence of methylcellulose (MC) treatment. tango2 mutants exhibited extensive overstretched sarcomeres (arrows) and damaged myofibers (arrowheads) on swimming in the MC-containing water compared to those in controls (n=6-8 in each group). Nuclei are shown in blue. Images are representative of n=6 larvae in each group. Scale bar: 5 µm. (B,C) Quantification of the swimming behavior of control and tango2 mutants (tango2bwg210 and tango2bwg211) before and after MC treatment (n=96). Two-way ANOVA (mixed model) with multiple comparisons was performed between different groups. ns, not significant; *P<0.05; **P<0.01; ***P<0.005.

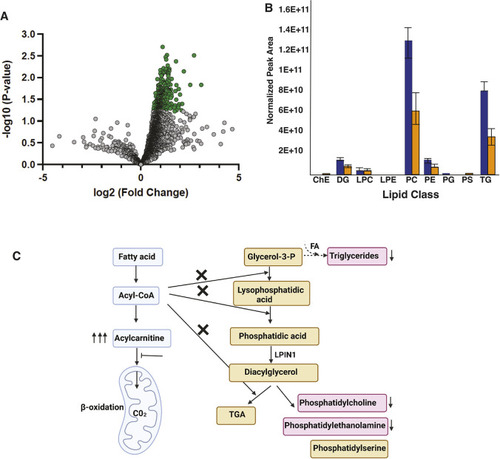
Changes in lipid composition in Tango2 deficiency. (A) Volcano plot of lipid log2(fold change) values in controls versus tango2 mutants (4 weeks). Fold differences are calculated as the ratio of lipids in WT to those in tango2 mutants. Dots in green represent the lipids with the lowest levels in tango2 mutants in comparison to controls (P<0.05). (B) Normalized profiles of different lipids classes (blue, control; orange, tango2 mutants). ChE, cholesterol ester; DG, diglyceride; LPC, lysophosphatidylcholine; LPE, lysophosphatidylethanolamine; PC, phosphatidylcholine; PE, phosphatidylethanolamine; PG, phosphatidylglycerol; PS, phosphatidylserine; TG, triglyceride. Data show the mean±s.e.m. Unpaired two-tailed t-test was used to determine significance. *P<0.05. (C) Working model of the effect of Tango2 deficiency on lipid metabolism: tango2 mutants exhibit a decreased abundance of phospholipids and triglycerides (pink) indicating a defect in the glycerol-3-P pathway. The protein product of LPIN1, a rhabdomyolysis-causing gene, catalyzes diacylglycerol synthesis in the glycerol-3-P pathway. Triglycerides are energy stores synthesized using glycerol-3-phosphate and fatty acids (FA) and are reduced in Tango2 deficiency. Some patients' fibroblasts exhibit acylcarnitine accumulation, which may limit acyl-CoA availability for the glycerol-3-P pathway, resulting in phospholipid deficiency. TGA: Triacylglycerol.

Acknowledgments
This image is the copyrighted work of the attributed author or publisher, and ZFIN has permission only to display this image to its users. Additional permissions should be obtained from the applicable author or publisher of the image. Full text @ Dis. Model. Mech.