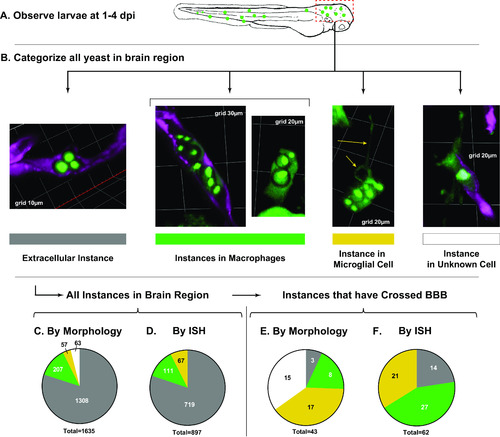
Quantification of cryptococcal yeast cells in the brain from 1 to 4 dpi. (A) Schematic workflow. Instances of cryptococcal yeast in the brain were quantified in observation and enumerated in the brains of a total of 77 live larvae compiled in 3 replicates. (B) Instances were categorized based on morphology. Note that cells with macrophage morphology are seen both inside and outside the vasculature. (C) Morphological quantification of all brain instances in live larvae. Colors correspond with the bars in B; gray, extracellular; green, macrophages; yellow, microglia; white, uncertain morphology. (D) Quantification of all brain instances in a separate set of fixed larvae using ISH for positive identification of microglia. (E) Quantification of the subset of instances that have crossed the BBB in the live larva set. (F) Quantification of the subset of instances that had crossed in the fixed larva set.

(A to F) Analysis of brain instances in mpr1Δ infection (A and B) and in PU.1 morphant larvae (C to F). (A) Crossing efficiency (number of crossings per instance in the whole experiment) in the original control data set of 77 larvae, matched control (JMD163) infection (closed circle), and mpr1Δ infection (closed square). The latter 2 sets were obtained simultaneously and consisted of 3 replicates of 10 larvae each. Pairwise analyses throughout the figure represent Welch’s t test of log-transformed ratios. (B) Intracellular mpr1Δ yeast cells (brackets) in the parenchyma after crossing the BBB; Ph, uninfected phagocytes. (C) Percent reduction in phagocytes in PU.1 morphants compared to larvae that received control morpholino. All mpeg+ cells decreased in the brain, but apoE+ cells decreased more. (D and E) Instances per fish (D) and crossing efficiency (E) comparison between the original control data set of 77 larvae, control morpholino (2 replicates of 10 larvae each), and PU.1 morpholino (3 replicates of 16, 15, and 13 larvae). (F) Status of crossing instances in PU.1 morphant infections; n = 3 replicates as in C and D; gray, extracellular; white, intracellular. (G) Example of endothelial breakdown in the brain during infection of PU.1 morphant. Infected Phagocyte inside a deteriorating vessel. White arrowheads indicate fragments of endothelial cytoplasm.

Quantification of mpr1Δ infection of control versus PU.1 morphants. (A) Total brain instances extracellular (gray) and intracellular (white); mpr1Δ + control morphant, n = 3 replicates of 10 larvae each; mpr1Δ + PU.1 morphant, n = 3 replicates of 9, 10, and 10 larvae. (B) Status of crossing instances from same replicates as A. (C) Crossing efficiency in same replicates as A and B. Pairwise analyses throughout the figure represent Welch’s t test of log-transformed ratios.

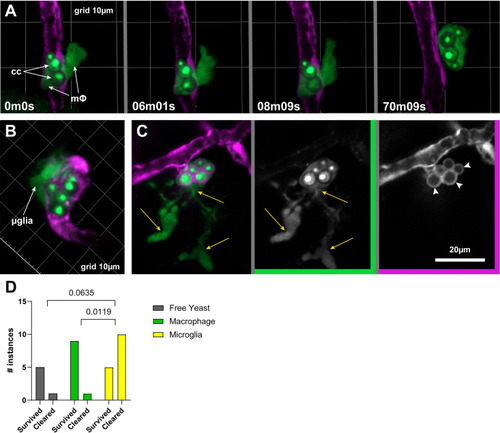
Macrophage and microglia in BBB crossing and subsequent fate of Cryptococcus. (A) Intravascular macrophage (mΦ) containing cryptococcal yeast cells (cc) extends a pseudopod outside the vasculature and pulls its cargo along with it. Phagocytes (mpeg+) and yeast cells express EGFP. Note that nuclear-localized fluorescence signal emphasizes yeast cells versus phagocytes of the same color. Endothelial cells express cytoplasmic mCherry (magenta). (B) A presumed microglial cell (μglia) tightly associated with the abluminal side of a vessel containing Cryptococcus. (C) A cell with microglial morphology in the parenchyma (yellow arrows indicate ramifications) containing yeast cells along with endothelial cytoplasm (white arrowheads). (D) Fate of crossing instances compiled from the original control data set plus additional replicates performed specifically for this analysis. P values indicate results of a Fisher’s exact test applied to contingency data.

Acknowledgments
This image is the copyrighted work of the attributed author or publisher, and ZFIN has permission only to display this image to its users. Additional permissions should be obtained from the applicable author or publisher of the image. Full text @ Microbiol Spectr