
FIGURE SUMMARY
- Title
-
A High-Fat Diet Induces Muscle Mitochondrial Dysfunction and Impairs Swimming Capacity in Zebrafish: A New Model of Sarcopenic Obesity
- Authors
- Zou, Y.Y., Chen, Z.L., Sun, C.C., Yang, D., Zhou, Z.Q., Xiao, Q., Peng, X.Y., Tang, C.F.
- Source
- Full text @ Nutrients
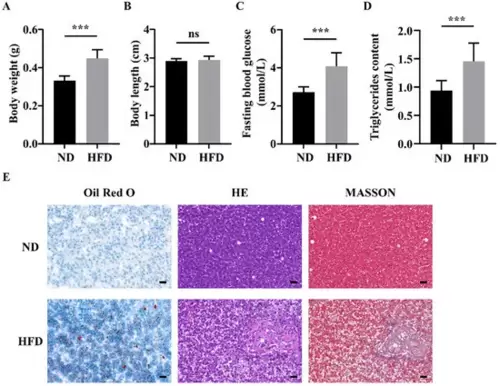
Figure 1. Long-term high-fat diet (HFD) feeding induced obesity and liver injury in zebrafish. (A) Body weight of zebrafish. (B) Body length of zebrafish. (C) Fasting blood glucose of zebrafish. (D) Muscle triglyceride contents. (E) Oil Red O staining, H&E staining, and Masson staining of zebrafish livers. ***, p < 0.001. Data represent means, and error bars represent standard errors of the means. Scale bar, 20 ?m. ND, normal diet; HFD, high-fat diet.
PHENOTYPE:
|
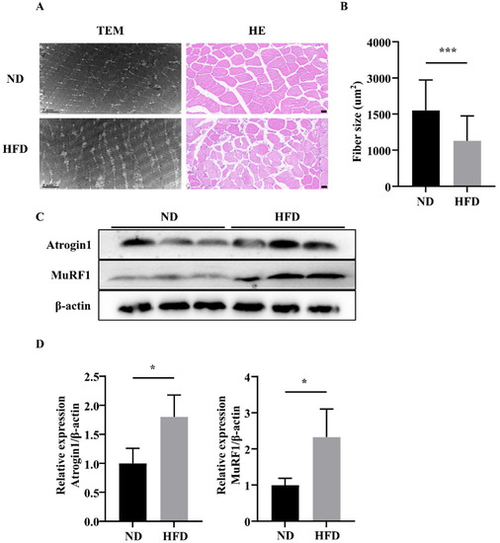
Figure 2. Comparison of skeletal muscle fiber size between zebrafish groups. (A) Representative photomicrographs of muscle sections stained H&E or imaged using transmission electron microscopy. (B) Average fiber size (based on H&E staining). (C,D) Atrogin-1 and MuRF1 protein expression. *, p < 0.05, ***, p < 0.001. Data represent means, and error bars represent standard errors of the means. Scale bars in transmission electron microscopy images, 2 ?m. Scale bars in H&E-stained images, 20 ?m. ND, normal diet; HFD, high-fat diet.
PHENOTYPE:
|
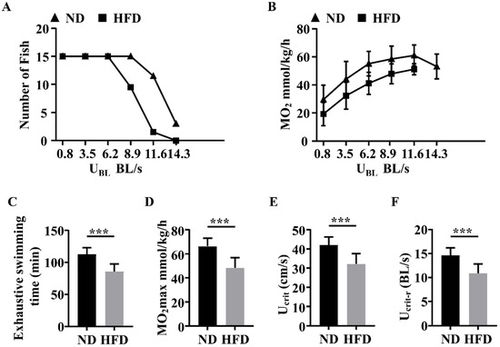
Figure 3. Comparison of swimming capacity tests between the two groups of zebrafish. (A) The number of zebrafish in the two groups at each speed test stage. (B) MO2 levels in the two groups at each testing stage. (C) Exhaustive swimming times of zebrafish. (D) MO2max of zebrafish. (E) Ucrit of zebrafish. (F) Ucrit-r of zebrafish. ***, p < 0.001. Data represent means, and error bars represent standard errors of the means. Scale bar, 20 ?m. ND, normal diet; HFD, high-fat diet; Ucrit, critical swimming speed; MO2, oxygen consumption.
PHENOTYPE:
|
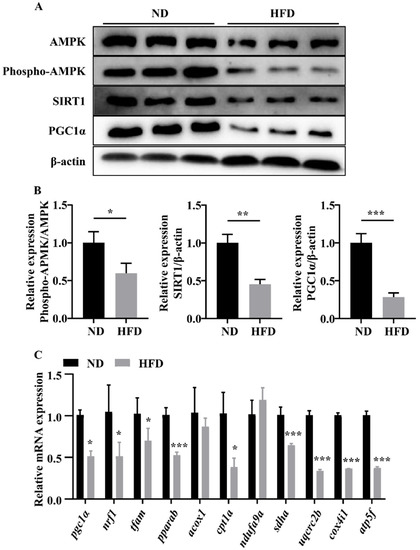
Figure 4. Long-term HFD feeding induced abnormal mitochondrial dysfunction. (A,B) Phospho-AMPK, SIRT1, and PGC1? protein levels. (C) mRNA expression of genes related to mitochondrial biogenesis, fatty oxidation, and ETC complexes subunits. *, p < 0.05, **, p < 0.01, ***, p < 0.001. Data represent means, and error bars represent standard errors of the means. ND, normal diet; HFD, high-fat diet; ETC, electron transport chain.
|
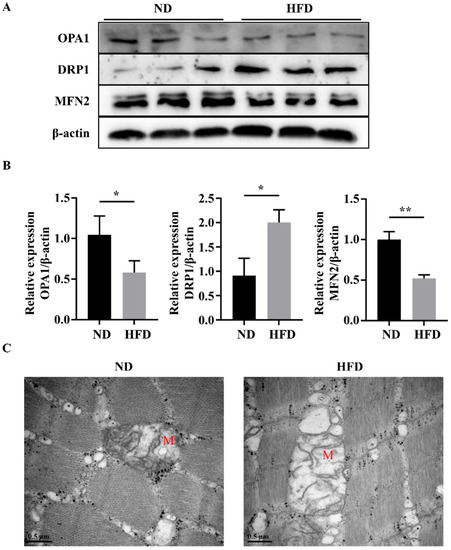
Figure 5. Long-term HFD feeding induced abnormal mitochondrial fusion and fission. (A,B) Protein expression of OPA1, MFN2, and DRP1. (C) Representative photomicrographs of muscle sections imaged using transmission electron microscopy. M, mitochondria. *, p < 0.05, **, p < 0.01. Data represent means, and error bars represent standard errors of the means. Scale bar in transmission electron microscopy images, 0.5 ?m. ND, normal diet; HFD, high-fat diet.
|
Acknowledgments
This image is the copyrighted work of the attributed author or publisher, and
ZFIN has permission only to display this image to its users.
Additional permissions should be obtained from the applicable author or publisher of the image.
Full text @ Nutrients