- Title
-
Transformed notochordal cells trigger chronic wounds destabilizing the vertebral column and bone homeostasis
- Authors
- Lˇpez-Cuevas, P., Deane, L., Yang, Y., Hammond, C.L., Kague, E.
- Source
- Full text @ Dis. Model. Mech.
|
PHENOTYPE:
|
|
|
|
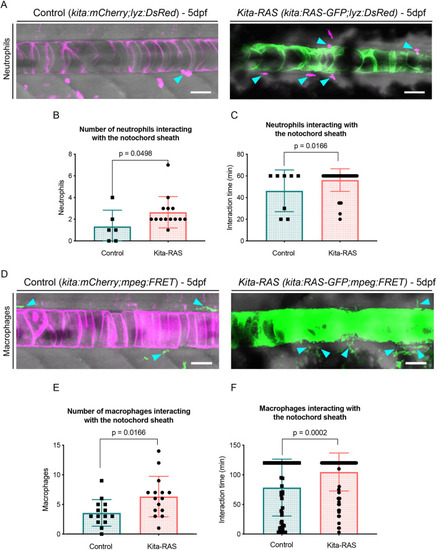
Maximum projections from confocal images of the notochord at 5?dpf in control (kita-mCherry) and kita-RAS, showing neutrophils (cyan arrowheads) interacting by contact with the notochord sheath layer. (B) Numbers of neutrophils interacting with the notochord sheath during the time lapse (controls n=6 fish, kita-RAS n=14 fish). (C) Interaction time between neutrophils and the notochord sheath during the time-lapse movies. Each dot or square represents one neutrophil (controls n=8 neutrophils, n=4 fish; kita-RAS n=39 neutrophils, n=14 fish). (D) Maximum projections from confocal images of the notochord of 5?dpf control (kita-mCherry) and kita-RAS fish, showing macrophages (cyan arrowheads) interacting by contact with the notochord sheath. (E) Numbers of macrophages interacting with the notochord sheath during the time lapse (controls n=14 fish, kita-RAS n=15 fish). (F) Interaction time between macrophages and the notochord sheath during the time-lapse movies. Each dot or square represents one macrophage (controls n=51 macrophages, n=13 fish; kita-RAS n=95 macrophages, n=15 fish). Unpaired, nonparametric t-test and Mann?Whitney test were used for all charts. Data are mean▒s.d.; P-values are indicated when significant (P<0.05). Scale bars: 50?Ám. PHENOTYPE:
|
|
PHENOTYPE:
|
|
PHENOTYPE:
|
|
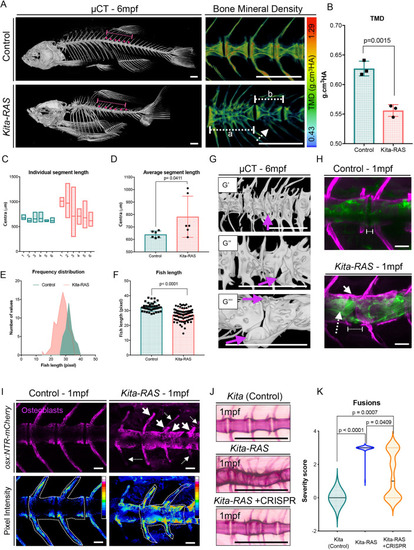
(A) ÁCT images of adult (6-month-old; 6?mpf) control (kita-mCherry) and kita-RAS. Note severe fusions and shortening of the fish length in kita-RAS. A zoomed region, colour coded for bone mineral density [tissue mineral density (TMD); in g/cm3 hydroxyapatite (HA)], is shown as an example. Note the decreased mineral density in kita-RAS. Fusions compromising two (white dashed line, b) to several vertebrae (white dashed line, a) are shown. The arches are also compromised (white dashed line arrow). Scale bars: 500?Ám. (B) TMD calculation. Unpaired two-tailed Student's t-test was used as a statistical test (two vertebrae per fish were analysed; control n=3 fish, kita-RAS n=3 fish). (C) Frequency distribution of the length of six consecutive segments, separated by a defined IVD space, were measured in Amira using 3D perspective measurement. The studied region is shown with a dashed line and magenta dots in A. kita-RAS show high variability in length of segments. (D) The average segment length was increased in kita-RAS. Six vertebrae per fish were analysed; control n=3 fish, kita-RAS n=3 fish. Unpaired, nonparametric t-test (Mann?Whitney test). (E) Frequency distribution of fish length in controls and kita-RAS measured in pixels, from X-ray images. (F) Fish lengths (measured in pixels) of controls (n=40) and kita-RAS (n=78). Unpaired, nonparametric t-test (Mann?Whitney test). (G) Higher-resolution ÁCT images to show abnormalities in detail. G?, fusions of several vertebrae and hemicentra (arrow). G?, lateral view of a hemicentra (arrow). G?, ventral view of a hemicentra (arrows). Scale bars: 500?Ám. (H) One-month-old (1?mpf) control (kita-mCherry) and kita:RAS-GFP stained with Calcein Green and Alizarin Red S, respectively, to label the bone (magenta). In kita-RAS, a hyperplastic notochord cell is indicated with a white dashed line arrow, mineralised IVD is indicated with a white arrow, and a region of incomplete mineralisation and future cleft is marked with a dashed line. Note that notochordal cells fail to organise in IVD domains. Scale bars: 50?Ám. (I) 1?mpf control and kita:RAS-GFP showing osteoblasts [Tg(osx:NTR-mCherry)]. Arrows indicate regions of increased osteoblasts; dashed line arrows show regions lacking osteoblasts and abnormal growth of arches. Pictures were processed to show pixel intensity (blue=low intensity), to visualise where osteoblasts are highly expressed. Two vertebrae in each fish were selected for quantification of mean pixel intensity. (J) Alizarin Red S staining of 1?mpf kita, kita-RAS and kita-RAS+CRISPR. Note an intermediate (less severe) phenotype in kita-RAS+CRISPR, suggesting rescue of bone phenotype. (K) Violin plot to show the distribution of vertebral column severity scores, from 0 (less severe) to 3 (most severe), in kita (n=47), kita-RAS (n=44) and kita-RAS+CRISPR (n=83). One-way ANOVA and Tukey's multiple comparisons test were used; P-values are indicated when significant. Scale bars: 50?Ám. PHENOTYPE:
|
|
PHENOTYPE:
|
|
|

