FIGURE SUMMARY
Title

Hmx3a Has Essential Functions in Zebrafish Spinal Cord, Ear and Lateral Line Development

Authors
England, S.J., Cerda, G.A., Kowalchuk, A., Sorice, T., Grieb, G., Lewis, K.E.
Source
Full text @ Genetics

Expression of hmx genes in WT zebrafish embryos. Lateral views of hmx expression in spinal cord (A–AD), hindbrain (S’, X’, AC’), eye and ear (A’, E’, F’, J’, K’, O’, P’, T’, U’, Y’, Z’, AD’), and lateral line primordium and neuromasts (B, C, L, M, Q, R, V, W) at 19 hpf (A–E, A’, E’), 24 hpf (F–J, F’, J’), 27 hpf (K–O, K’, O’), 36 hpf (P–T, P’, S’, T’), 42 hpf (U–Y, U’, X’, Y’), and 48 hpf (Z–AD, Z’, AC’, AD’). Rostral, left; Dorsal, up. (B, C, G, H, L, M, Q, R, V, W, AA, AB) hmx2 and hmx3a are expressed in spinal cord, lateral line primordium (white asterisks), neuromasts (black asterisks), and anterior ear (data not shown) at all stages examined, although hmx2 spinal cord expression initially appears weaker than hmx3a and does not extend as far caudally. While there is expression of both hmx2 and hmx3a in the lateral line primordium at 24 hpf (data not shown), the lateral line primordium has not yet migrated into the field of view shown in G and H. For consistency, the specific region of spinal cord shown (adjacent to somites 6–10) is identical in panels F–AD. At 19 hpf, expression is found only in the very anterior spinal cord and so a more rostral region of spinal cord is shown in A–E. (A, A’, E, E’, F, F’, J, J’, K, K’, O, O’, P, P’, T, T’, U, U’, Y, Y’, Z, Z’, AD, AD’) hmx1 and hmx4 are not expressed in WT spinal cord at any of these stages but are expressed in the eye (black arrowheads), and posterior-ventral ear and adjacent ganglion of the anterior lateral line (white arrowheads). (D, I, N, S, S’, X, X’, AC, AC’) hmx3b is not expressed in WT spinal cord at any of these stages. The only expression we observed was in the hindbrain between 36 and 48 hpf (black arrows). (G and H) The expression pattern of hmx2 and hmx3a is expanded in the spinal cord of mib1ta52b mutants but is unaltered in the ear and lateral line primordium (data not shown). (F, F’, J, J’) Neither hmx1 (F) nor hmx4 (J) are expressed in the spinal cord of mib1ta52b mutants, although the expression of both genes persists in the eye (black arrowheads), posterior-ventral ear and adjacent ganglion of the anterior lateral line (white arrowheads) (F’ and J’). (I) hmx3b is not expressed in mib1ta52b mutants, either in the spinal cord or in any other tissue. (F, I, J, K, N, O, P, S, S’, T, U’, X, X’, Y, Z, AC, AC’, AD) The background (diffuse, nonspecific staining) in these pictures is higher because we exposed the embryos to prolonged staining to ensure that there was no weak spinal cord expression. Especially in the brain, this can lead to background staining as the large ventricles of the hindbrain trap anti-sense riboprobes. Bar, 50 µm (A–AD), 120 µm (A’, E’, F’, J’, K’, O’, P’, S’, T’, U’, X’, Y’, Z’, AC’, AD’).

hmx2 and hmx3a are expressed in V1 and dI2 interneurons. (A–F) Lateral views of spinal cord at 27 hpf. Rostral, left; Dorsal, up. (A) hmx2 and hmx3a are coexpressed in V1 and dI2 interneurons. (B–F) V1 interneurons are inhibitory (slc32a1-expressing) (Jellali et al. 2002; Goulding et al. 2014) (B) and express en1b (C). dI2 interneurons are glutamatergic (excitatory, express slc17a6a/b) (Alaynick et al. 2011; Serrano-Saiz et al. 2013) (D) and express lhx1a (E), but not evx1 (F). Asterisks indicate double-labeled and white crosses indicate single-labeled hmx3a-expressing cells (green). Expression of other genes is red. Bar, 20 µm. (G) Heatmap analysis of gene expression profiling of V1 interneurons. A three-class ANOVA analysis of differential expression was performed on different FAC-sorted populations of cells. Class 1: All postmitotic spinal neurons. Class 2: V1 interneurons. Class 3: All trunk cells. Each column is a different biological replicate. Rows show relative expression levels for a single transcription factor gene as normalized data transformed to a mean of 0, with standard deviation of +1 (highly expressed) or −1 (weakly/not expressed) sigma units. Adjusted P-values corrected for multiple testing are <0.000001 for all genes shown. For more information on these experiments see (Cerda et al. 2009). Expression profiles are included for positive control genes (green), en1b and pax2a, that are expressed by V1 cells; and negative control genes (purple), gata3 and vsx1, that are expressed by other spinal cord interneurons, but not V1 cells. Data for lhx1a, lhx5, and hmx3a shows that they are coexpressed in V1 interneurons. (H) Schematic showing neurotransmitter and postmitotic transcription factor phenotypes of spinal cord interneurons found in the dorsal-ventral spinal cord region shown in panels A–F. It is currently unclear whether V0v interneurons express Lhx1/5 (*, see Results).

hmx2;hmx3a double knockdown (DKD) embryos have fewer excitatory (glutamatergic) and more inhibitory spinal cord interneurons. (A–D, E, F, H, I, K, L, N, O, Q, R, T, U, W, X) Lateral views of (A, B, E, F, H, I, K, L, N, O, Q, R, T, U, W, X) spinal cord at 27 hpf and (C and D) otic vesicles at 3 d. Rostral, left; Dorsal, up. (G, J, M, P, S, V, Y) Mean number of cells expressing hmx3a (G), en1b (J), slc17a6a/b (M, S, V, Y), and slc32a1 (P) in a precisely defined spinal cord region adjacent to somites 6–10 at 27 hpf. All counts are an average of at least five embryos. Data are depicted as individual value plots and the n-values for each genotype are also shown. For each plot, the wider red horizontal bar depicts the mean number of cells and the red vertical bar depicts the SEM (SEM values are listed in Table 1). Statistically significant (P < 0.001) comparisons are indicated with brackets and three asterisks. All data were first analyzed for normality using the Shapiro–Wilk test. Data set in G is nonnormally distributed and was, therefore, analyzed with the Wilcoxon–Mann–Whitney test. Data sets in J, M, P, S, V, and Y are normally distributed and so, for the pairwise comparison shown in J, the F-test for equal variances was performed. This data set has equal variances and so a type 2 (for equal variances) Student’s t-test was performed. To accurately compare the four different data sets each shown in panel M, P, S, V, and Y, a one-way ANOVA test was performed. All data sets for ANOVA analysis have both normal distributions and homogeneous (homoscedastic, Bartlett’s test P > 0.05) variances and so standard ANOVA analysis was performed. All ANOVA analyses shown are significant [M: ANOVA F(3,76) = 231.5, P ≤ 0.0001; P: ANOVA F(3,19) = 80.64, P ≤ 0.0001; S: ANOVA F(3,76) = 196.3, P ≤ 0.0001; V: ANOVA F(3,56) = 34.97, P ≤ 0.0001; and Y: ANOVA F(3,56) = 61.14, P ≤ 0.0001], and so to determine which specific experimental group or groups differed, Tukey’s honestly significant difference post hoc test for multiple comparisons was performed. Mean numbers of cells and P-values are provided in Table 1. In some cases, cell count data were pooled from different experiments (uninjected control data in M, S, V, and Y from 12 pooled experiments, hmx2;hmx3a DKD data in M and S from 4 pooled experiments, hmx2 SKD data in M and V from 2 pooled experiments, and hmx3a SKD data in M and Y from 2 pooled experiments). As in situ hybridization staining can vary slightly between experiments, we only pooled data from different experiments, or compared different morpholino injection experiments if pairwise comparisons of the counts from corresponding uninjected WT control embryos were not statistically significantly different from each other. (A and B) By 27 hpf, in an uninjected WT control embryo krt15 mRNA expression shows that the lateral line primordium (LLP) has migrated to its expected position over somite 10 (S10 + black arrow) (A). In contrast, at 27 hpf in hmx2;hmx3a DKD embryos, the LLP is stalled beside somites 1-4 (S1, S4, black arrows, B). This is identical to the stalled LLP phenotype observed in hmx3aSU3 and hmx2;hmx3aSU44 mutants (see Figure 5, O and P). Dotted line indicates dorsal spinal cord boundary in A and dorsal posterior hindbrain and anterior spinal cord boundary in B. (C and D) Also like hmx3aSU3 and hmx2;hmx3aSU44 mutants (see Figure 5, U and V), hmx2;hmx3a DKD embryos have fused otoliths at 3 d (D), but uninjected controls have not (C). (E–J) There is no change in the number of hmx3a- or en1b-expressing spinal cells in hmx2;hmx3a DKD compared to uninjected control embryos, suggesting that V1 and dI2 interneurons do not die or transfate/change into different cell types. (K–M) The number of slc17a6a/b-expressing (excitatory) spinal cells is reduced in both double and single knockdown (SKD) embryos, with the reduction being more severe in DKD embryos. (N–P) Concomitantly, there is a statistically significant increase in the number of slc32a1-expressing (inhibitory) cells in both SKD and DKD embryos, with the increase being more profound in DKD embryos. (Q–S) Injection of either morpholino-resistant hmx2 (Q) or hmx3a mRNA (R) partially rescues the number of spinal excitatory cells in DKD embryos. (T–V) Injection of either morpholino-resistant hmx2 (T) or hmx3a mRNA (U) fully rescues the number of spinal excitatory cells in hmx2 SKD embryos. (W–Y) Injection of morpholino-resistant hmx2 mRNA (W) partially rescues the number of spinal excitatory cells in hmx3a SKD embryos, but injection of morpholino-resistant hmx3a mRNA (X) fully rescues the phenotype. Bar, 30 µm (A, B, E, F, H, I, K, L, N, O, Q, R, T, U, W, and X); 80 µm (C and D).

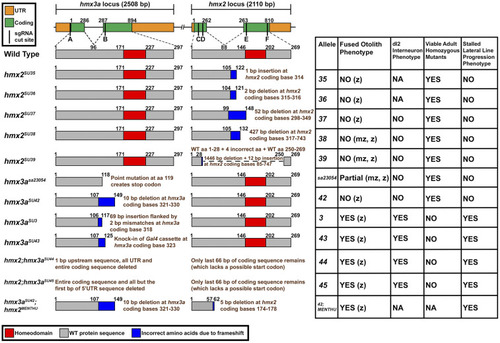
Summary of hmx2/3a mutant alleles analyzed and their phenotypes when homozygous. Left: schematics of 11 mutant alleles and one double mutant analyzed. Top row indicates genomic locus; lower rows indicate predicted protein products. There is a 6454 bp gap between hmx2 and hmx3a. Vertical black bars on genomic locus indicate locations of sgRNA sequences, A–F, used to generate the mutants shown. These sequences and the combinations of sgRNAs used to generate the mutants shown here are listed in Table S2. For each mutant allele, the genomic location plus the nature of the mutation or indel size is shown in brown text at the right side of each mutant protein schematic. Coding bases refer to the translated sequence, e.g., coding bases one to three correspond to the bases encoding the start methionine. Right: Column 1 indicates allele number. Column 2 indicates whether embryos with fused otoliths were observed in incrosses of heterozygous (z) or homozygous (mz) parents (also see Table 3 and Figure 5). Column 3 indicates whether a reduction in the number of spinal excitatory cells was observed at 27 hpf in homozygous mutants, as assayed by in situ hybridization for slc17a6a/b (Figure 5 and data not shown). Column 4 indicates whether viable adult homozygous mutants were recovered. In all cases where adult homozygous mutants were identified, the numbers of these fish are not statistically significantly different (P > 0.214) from expected Mendelian ratios, as assayed by a chi-squared test. P-values are provided in Table 3. Column 5 indicates whether embryos with stalled lateral line progression phenotypes were observed in incrosses of heterozygous parents. All hmx2 stable mutant alleles recovered to date are homozygous viable and homozygous mutants do not have a reduction in the number of glutamatergic spinal cord interneurons or otolith or stalled lateral line progression phenotypes. This is the case, even for embryos from incrosses of fish homozygous mutant for the most severely deleted hmx2 alleles (hmx2SU38 and hmx2SU39). hmx3asa23054 mutants are also homozygous viable. They have variable, incompletely penetrant, otolith fusion phenotypes. Strikingly, only 27.41% of embryos from an incross of homozygous mutant parents have otolith fusion phenotypes (Table 3). hmx3asa23054 mutants do not have a reduction in the number of glutamatergic spinal cord interneurons or stalled lateral line progression phenotypes. hmx3aSU42 mutants are homozygous viable and do not have any obvious abnormal phenotypes, even though this allele should encode a protein with the same number of WT amino acids as hmx3aSU43 and only one more WT amino acid than hmx3aSU3. hmx2;hmx3aSU44 and hmx2;hmx3aSU45 differ only in the amount of upstream sequence that is deleted and have identical phenotypes.

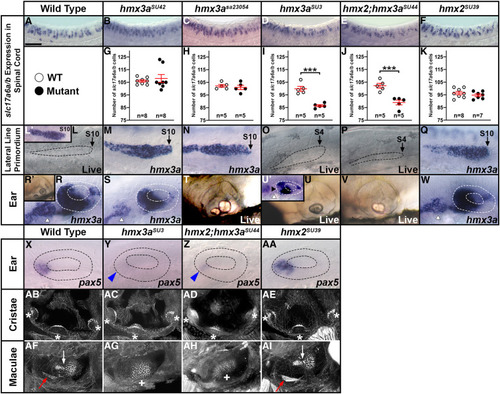
Only some hmx2/3a alleles have mutant phenotypes. (A–F, L–AI, L’, R’ U’) Lateral views. Rostral, left; Dorsal, up. (A–F) Expression of slc17a6a/b in spinal cord at 27 hpf. (G–K) Number of cells expressing slc17a6a/b in a precisely defined spinal cord region adjacent to somites 6–10 at 27 hpf. Data are depicted as individual value plots and the n-values for each genotype are also shown. For each plot, the wider red horizontal bar depicts the mean number of cells and the red vertical bar depicts the SEM (SEM values are listed in Table 2). All counts are an average of at least five embryos. Statistically significant (P < 0.001) comparisons are indicated with brackets and three asterisks. White circles indicate WT data and black circles the appropriate mutant data as indicated in key under panel A. All data were first analyzed for normality using the Shapiro–Wilk test. Data in G is not normally distributed and so a Wilcoxon–Mann–Whitney test was performed. Data sets in H–K are normally distributed and so the F-test for equal variances was performed, followed by a type 2 Student’s t-test (for equal variances). P-values are provided in Table 2. (L–Q, L’) Lateral line primordium phenotypes examined either by hmx3a expression (L’, M, N, Q) or live (L, O, P) at 27 hpf. (R–AI, R’, U’) Ear phenotypes examined either by hmx3a expression at 27 hpf (R, S, U’, W), live at 4 d (R’, T–V), pax5 expression at 24 hpf (X–AA) or phalloidin staining at 4 d (AB–AI). (A–K). There is no change in the number of spinal excitatory neurons in hmx3aSU42 (B and G) and hmx3asa23054 (C and H) and hmx2SU39 (F and K) mutant embryos compared to WT (A). In contrast, there is a statistically significant reduction in hmx3aSU3 (D and I) and hmx2;hmx3aSU44 (E and J) mutant embryos. (L–Q, L’). At 27 hpf, the tip of the lateral line primordium (black dotted line, L) has reached somite 10 (S10) in WT embryos (L and L’). This rate of migration is unchanged in hmx3aSU42, hmx3asa23054, and hmx2SU39 mutant embryos (M, N, Q). (O and P) In contrast, the lateral line primordium fails to migrate in hmx3aSU3 (O) and hmx2;hmx3aSU44 (P) mutant embryos. Instead, it is stalled adjacent to somites one to four (S4, somite 4). (R, S, U’, W) hmx3a expression in the ear (inside white dotted lines) and in presumptive neuroblasts anterior to the ear (white arrowheads) is unchanged in hmx3aSU42 (S) and hmx2SU39 (W) mutants, compared to WT embryos (R), but is severely reduced in both the presumptive neuroblasts anterior to the ear and the anterior ear (black arrowhead) in hmx3aSU3 mutants (U’). (T) hmx3asa23054 mutants show incompletely penetrant, variable otolith fusion phenotypes, ranging from no fusion (like WT ear in R’), through incomplete fusion (T), to complete fusion, like that observed at full penetrance in hmx3aSU3 (U) and hmx2;hmx3aSU44 (V) mutant embryos. (X–AA) The expression of pax5 in the anterior ear (inside black dotted lines) is unchanged in hmx2SU39 (AA) mutants, compared to WT embryos (X), but is severely reduced (blue arrowhead) in both hmx3aSU3 (Y) and hmx2;hmx3aSU44 (Z) mutants. (AB–AI) The three cristae of the ear (white asterisks) form normally in WT (AB), hmx3aSU3 (AC), hmx2;hmx3aSU44 (AD), and hmx2SU39 (AE) mutants. In contrast, the spatially distinct anterior (utricular, red arrow) and posterior (saccular, white arrow) maculae are unchanged in hmx2SU39 (AI) mutants, compared to WT embryos (AF), but are fused and are located in a more medio-ventral position (white cross) in hmx3aSU3 (AG) and hmx2;hmx3aSU44 (AH) mutants. However, there are no obvious differences between hmx3aSU3 and hmx2;hmx3aSU44 mutants. Bar, 50 µm (A–F), 30 µm (L–W), 20 µm (X–AA), 60 µm (L’, R’, U’, AB–AI). Panels X, Y, AB, AC, AF, and AG are reproduced from Hartwell et al. (2019) as per the Creative Commons Attribution (CC BY) license at PLoS Genetics.

Analysis of hmx3a single and hmx2;hmx3a deletion mutants. (A–J, P–AA, and AG) Lateral views of hmx3a (A and F), en1b (B and G), slc32a1 (C, D, H, and I), slc6a5 (E and J), gad1b (P–T, V–Z), or krt15 (U, AA, and AG) expression in spinal cord (A–J, P–T, V–Z) or lateral line primordium (U, AA, and AG) at 27 hpf (A–J, P, Q, U–W, AA, and AG) or 48 hpf (R–T, X–Z). Rostral, left; Dorsal, up. (K–O, AB–AF). Number of cells expressing hmx3a (K), en1b (L), slc32a1 (M and N), slc6a5 (O), and gad1b (AB–AF) in a precisely defined spinal cord region adjacent to somites 6-10 at 27 hpf (K–O, AB, and AC) or 48 hpf (AD–AF). Data are depicted as individual value plots and the n-values for each genotype are also shown. For each plot, the wider red horizontal bar depicts the mean number of cells and the red vertical bar depicts the SEM (SEM values are listed in Table 2). All counts are an average of at least five embryos. Statistically significant (P < 0.05) comparisons are indicated with brackets and asterisks. * P < 0.05, ** P < 0.01, *** P < 0.001. White circles indicate WT data and black circles the appropriate mutant data as indicated in key under panel AG. All data were first analyzed for normality using the Shapiro–Wilk test. Data sets in M, AB and AF are nonnormally distributed and were analyzed with the Wilcoxon–Mann–Whitney test. Data sets in K, L, N, O, AC, AD, and AE are normally distributed and so the F-test for equal variances was performed. All of these had equal variances, so a type 2 Student’s t-test was performed. P-values are provided in Table 2. (A, B, F, G, K, and L) As in DKD embryos (Figure 3), dI2 and V1 interneurons do not die, nor do dI2 interneurons transfate/change into V1 interneurons in hmx3aSU3 mutant embryos, since the numbers of hmx3a- (A, F and K) and en1b-expressing cells (B, G and L) do not change compared to WT embryos. There is a statistically significant increase in the number of inhibitory, slc32a1-expressing cells in hmx3aSU3 mutants (C, H, and M) and hmx2;hmx3aSU44 mutants (D, I, and N) compared to WT embryos. However, at 27 hpf, the number of slc6a5-expressing cells is unchanged between WT and hmx3aSU3 mutants (E, J and O), whereas there is an increase in the number of GABAergic (gad1b-positive) cells in hmx3aSU3 (P, V, and AB) and hmx2;hmx3aSU44 mutants (Q, W, and AC), suggesting that the additional inhibitory cells in the mutant embryos are GABAergic and not glycinergic. (R, S, X, Y, AD, and AE) There is an equivalent increase in GABAergic (gad1b-positive) cells at 48 hpf in hmx3aSU3 and hmx2;hmx3aSU44 mutant embryos. However, there is no change in the number of GABAergic (gad1b-positive) cells at 48 hpf in hmx2SU39 mutants, compared to WT embryos (T, Z, and AF). (U, AA, and AG). hmx3aSU42/+;hmx3aSU3/+trans-het embryos have two different lateral line primordium progression phenotypes at 27 hpf. Bar, 50 µm.

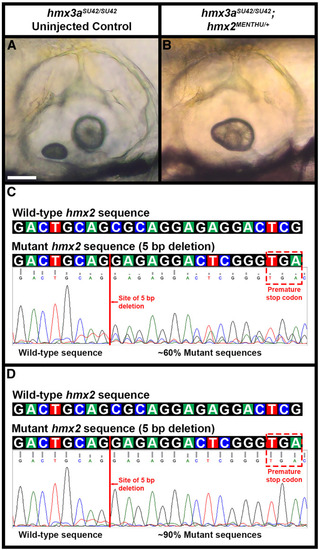
Phenotypic and genotypic analysis of embryos from an incross of hmx3aSU42/+ parents injected with hmx2MENTHU CRISPR reagents. (A and B) Lateral views of ear phenotypes at 4 day in live uninjected (A) and hmx2MENTHU CRISPR-injected (B) hmx3aSU42 homozygous mutant embryos. Rostral, left; Dorsal, top. The uninjected hmx3aSU42 homozygous mutant embryo has two normal otoliths in each ear (A). In contrast, the hmx2MENTHU CRISPR-injected hmx3aSU42 homozygous mutant embryo has fused otoliths in both ears. (C and D) Wild-type (top row) and hmx2MENTHU (bottom row) genomic sequences on top. Each colored box represents a specific nucleotide in the hmx2 coding sequence: A, green; C, blue; G, black; T, red. The hmx2MENTHU mutant sequence contains a 5 bp deletion (CGCAG, red line), which introduces a premature stop codon (red dashed box) 14–16 bases after the deletion. Sequencing traces (below) from individual embryos from an incross of hmx3aSU42/+ parents injected with hmx2MENTHU CRISPR reagents. In the injected embryos, hmx2MENTHU mutant sequences (with the 5 bp deletion) comprise ∼60% (C) to 90% (D) of all amplified sequences at this locus. Bar, 50 µm (A and B).

PHENOTYPE:
Fish:
Knockdown Reagent:
Observed In:
Stage: Day 4

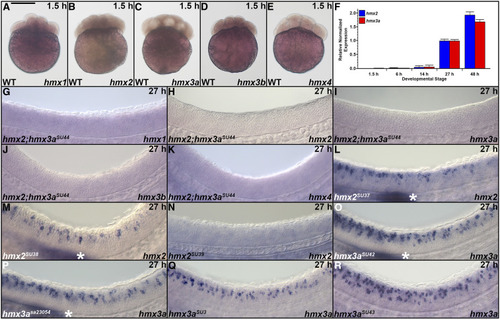
Expression of hmx genes in mutant zebrafish embryos and before the midblastula transition. (A–E, G–R) Lateral views of expression in whole embryos at 1.5 hpf (16 cells, A–E) or the spinal cord (G–R) at 27 hpf. (A–E) Animal pole, up. (G–R) Rostral, left; Dorsal, up. (L and M, O and P) White asterisk indicates expression in the lateral line primordium. None of the hmx genes are maternally expressed at 1.5 hpf, as assessed by in situ hybridization (A–E), and, in the case of hmx2 and hmx3a, quantitative RT-PCR on whole embryos (F). No maternal expression of hmx2 and hmx3a was detected and zygotic expression was not observed via quantitative RT-PCR until 14 hpf (F). hmx1 (G), hmx3b (J), and hmx4 (K) are not expressed in the spinal cord of hmx2;hmx3aSU44 deletion mutants. However, hmx1 and hmx4 were still expressed in the head, as shown in Figure 1 (data not shown), confirming that the in situ hybridization experiment had worked. We never detect expression of hmx3b in WT embryos at 27 hpf (see Figure 1). (H and I) As expected, given the deletion of the entire hmx3a coding sequence and all but the last 66 bp of hmx2 coding sequence in hmx2;hmx3aSU44 mutants (Figure 4), we did not detect any hmx2 (H) or hmx3a (I) transcripts in these mutants. (L and M) hmx2 mRNA does not exhibit nonsense-mediated decay (NMD) in hmx2SU37 or hmx2SU38 mutants. (N) In hmx2SU39 mutants, deletion of all but the first 84 and the last 60 bases of hmx2 coding sequence (Figure 4) generates a severely truncated hmx2 transcript that cannot be detected by our hmx2 ISH probe. Generation of a short ISH probe targeted to the predicted truncated transcript product of hmx2SU39 mutants also failed to detect hmx2 expression in these mutants (data not shown). (O–R) hmx3a mRNA does not exhibit NMD in hmx3aSU42 (O), hmx3asa23054 (P), hmx3aSU3 (Q), or hmx3aSU43 (R) mutant embryos. Bar, 280 µm (A–E), 50 µm (G–R).

Acknowledgments
This image is the copyrighted work of the attributed author or publisher, and ZFIN has permission only to display this image to its users. Additional permissions should be obtained from the applicable author or publisher of the image. Full text @ Genetics