FIGURE SUMMARY
Title

Inappropriate cathepsin K secretion promotes its enzymatic activation driving heart and valve malformation

Authors
Lu, P.N., Moreland, T., Christian, C.J., Lund, T.C., Steet, R.A., Flanagan-Steet, H.
Source
Full text @ JCI Insight

TALEN-mediated KO of <italic>gnptab</italic> disrupts cardiovascular development.

(A) Schematic of gnptab gene shows the locations of the left and right TALEN arms, the PCR primers used for genotyping (black arrowheads), and 3 isolated zebrafish lines carrying 2, 5, and 7 bp frame-shifting deletions. The predicted “translation” of these products is listed. (B) BslI digestion of genomic DNA identifies gnptab WT (+/+), heterozygous (+/–), and homozygous mutant (–/–, MLII) animals. (C) High-resolution melt analyses yields unique patterns that confirm the 3 expected genotypes. (D) Schematic illustrates live embryo dissections used in HRM analyses to assign the genotypes before experiments. Images of 3- and 5-dpf-old WT and MLII (gnptab–/–) animals from lines carrying 5 and 7 bp deletions (gnptabga2.5 and gnptabga3.7) show progressive cardiac edema. Percent values equal the number of embryos exhibiting phenotypes similar to the picture. n = 50–60 embryos from 4–5 independent matings per line. Scale bar: 100 μm. Red arrowheads indicate edema; black arrowhead indicates pooled blood. (E) RT-PCR analyses of gnptab expression of embryos from 2 pools of WT and 3 pools of 5 bp–deleted and 7 bp–deleted embryos show reduced transcript abundance. Analyses of rpl4 transcripts provides an internal reference. Representative gel of 4 independent experiments. (F) Quantitation of transcript abundance show 60%–75% reduction in MLII lines from 3 to 5 dpf. Gel extraction and sequencing show 100% of residual transcripts in the mutant lines are mutant mRNAs. n = 100 embryos from 4 experiments, with 20 cloned transcripts sequenced per condition. ***P < 0.001, Dunnett’s test with correction.

Loss of <italic>gnptab</italic> gene expression disrupts heart looping and AV valve formation.

(A) Fluorescent stereoscopic images of 3 dpf WT and gnptab morphants (MO) in the myl7:EGFP (labels cardiomyocytes) background show reduced looping and inferior edema (red arrow) in MLII hearts. Red arrowheads highlight edema. Similar phenotypes are noted in gnptab mutants (ga2.5 shown) stained immunohistochemically for myosin. Scale bar: 50μm. V, ventricle; A, atrium. Percent values equal the number of embryos exhibiting phenotypes similar to the picture. n = 30 embryos from 4–5 independent matings. (B) Schematic of AV valve formation. (C) Live confocal imaging of tie2:EGFP+ hearts reveal abnormal uncondensed valves in gnptab morphants that do not open and close as the heart beats. n = 35–40 total embryos from 3 independent matings. Scale bar: 10 μm. Red arrowheads highlight the canal between the left and right sides of the valve. (D) Live confocal imaging of tie2:EGFP+gnptab mutant (ga2.5 shown) valves show similar disruption in architecture and behavior. Images 1–4 show WT valves opening and closing at regular intervals, while the gnptab/MLII mutant valves remain open in images 1,2, and 4. Scale bar: 20μm. n = 25 embryos from 3 matings. Red arrowheads highlight left and right sides of the valve, which fully “close” in WT but not mutant embryos. (E) In situ analyses of notch1b transcripts show that differentiation of endocardial and AV valve cells is disrupted in both gnptab morphants and mutants, with expression present throughout the endocardium (yellow lines) instead of restricted to valvular regions (yellow arrow heads). Scale bar: 50μm. Percent values equal the number of animals with pictured phenotype. n = 75 embryos from 3 experiments. (F) Schematic illustrates key aspects of early heart and valve development and summarizes the events disrupted in MLII embryos.

Disruptions in BMP and TGF-β signaling are associated with MLII heart and valve defects.

(A) Schematic illustrates role for TGF-β, BMP, and Notch signals during AV valve development comparing mammals and fish. PG, proteoglycan; VPC, valve precursor cell; EMT, endocardial to mesenchymal transition. (B and C) In situ analyses of aggrecan (acana, red arrowheads) (B) and osteopontin (spp1, yellow arrowheads) (C) in 4 dpf embryos show defects in expression of the cardiac jelly are associated with loss of mesenchymal migration in gnptab/MLII morphants and mutants. Percent values indicate the number of embryos with the pictured phenotype. n = 50–65 embryos from 3 experiments. Scale bar: 50 μm. (D) Confocal images of WT and gnptab morphants stained immunohistochemically for myosin (red) and either pSmad1/5/8 or pSmad2 (green) illustrate reduced BMP and increased TGF-β signaling in MLII hearts. Boxed areas highlight region particularly affected, which are magnified in panels to the right. V, ventricle; A, atrium; OFT, outflow tract. n = 25 embryos from 3 independent matings. Scale bar: 20 μm. (E) Graphs show the percentage of cells in the ventricle and atrium with nuclear localized pSmad2 and pSmad1/5/8 staining. Data are presented as mean ± SEM. ****P < 0.0001 using 2-tailed Student’s t test. (F) Live confocal images of 4 dpf embryos expressing the BRE:dsEGFP (reports BMP signaling, denoted by white arrowheads) and myl7:RFP (labels cardiomyocytes red) confirm reduced BMP signaling (labeled green by BRE:dsEGPP) in the ventricle of MLII hearts, which is restored when TGF-β signaling is inhibited with SB505124. n = 10–12 embryos from 3 independent experiments. (G) Confocal images of tie2:EGFP+ (green) WT, gnptab-deficient morphants, and TGF-β–inhibited gnptab-deficient morphants treated with SB505124. Embryos stained immunohistochemically for myosin (red). n = 25–30 embryos from 3 independent experiments. Scale bar: 30 μm. (H) Graphs show percent of embryos whose hearts loop normally and that exhibit edema. For simplicity, each dot represents the average value obtained from an experiment containing 25–30 embryos. Total n > 100 embryo per condition. Data represent mean ± SEM. ****P < 0.0001 using Dunnett’s test with correction.

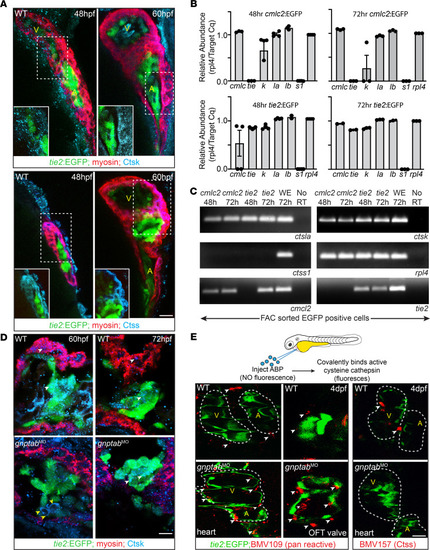
Cathepsin proteases are expressed in developing hearts.

(A) Confocal images of 48–60 hpf tie2:EGFP+ (labels valves green) hearts stained immunohistochemically for myosin (red) and either Ctsk or Ctss (blue) show cathepsin proteases are expressed in multiple regions of heart, with Ctsk enriched in cardiomyocytes (see insets of boxed regions) throughout ventricle and atria and Ctss predominantly present in region between the 2 chambers (see inset of boxed regions). n = 15–25 embryos imaged per condition. Scale bar: 20μm. V, ventricle; A, atrium. (B) qPCR of FAC sorted EGFP+ cardiomyocytes (cmlc:EGFP) and endocardial (tie2:EGFP) cells. Transcript abundance calculated relative to rpl4. Data are presented as mean ± SEM (C) Gel-based RT-PCR analyses of cathepsin expression in FACS-sorted cells. n = 50–100 embryos per sort. Representative gel from 3–4 independent experiments. (D) Confocal images of cryosections from 60–72 hpf tie2:EGFP+ (labels valves green) hearts stained immunohistochemically for myosin (red) and Ctsk (blue). n = 15 embryos imaged per condition. Scale bar: 20 μm. (E) Schematic illustrates cardiac injection of an activity-based probe (ABP), which does not fluoresce until covalently bound to an activated cysteine cathepsin. Confocal images of WT and gnptab morphants (MO) labeled with the pan reactive probe BMV109 reveal generally increased cathepsin activity (red, denoted by white arrowheads) present throughout the MLII heart. Injection of the Ctss-specific probe BMV157 (red) shows its activity is reduced in the MLII heart compared with other cathepsins, likely K and L. Representative images from 3 independent experiments, n = 30 embryos per condition. Scale bar: 30 μm. OFT, outflow tract.

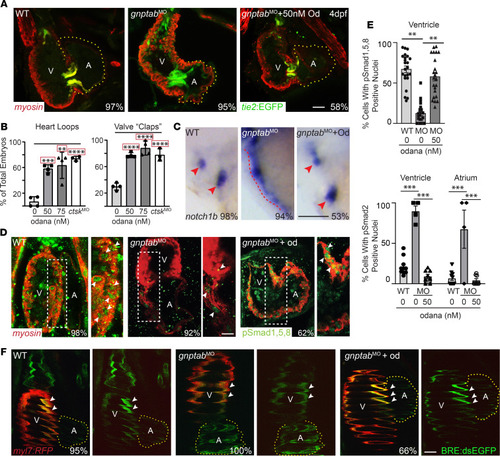
Treatment with the cathepsin K inhibitor odanacatib rescues MLII heart defects.

(A and B) Confocal analyses of tie2:EGFP+ (green) hearts stained immunohistochemically for myosin (red) show that treatment with 50 nM odanacatib restores normal morphology to MLII hearts and valves, as assayed by the number of MLII embryos with hearts that loop and valves that open and close (“clap”) at regular intervals following treatment. Percent values on images represent the number of embryos with the pictured phenotype. n = 100–125 embryos. Data are presented as mean ± SEM. **P < 0.01,***P < 0.001, ****P < 0.0001 using Dunnett’s test with correction (indicated by red box). Each dot represents the average of 20–25 embryos from 4–5 experiments. Scale bar: 25 μm. (C) In situ analyses of notch1b expression show restored differentiation of MLII valve cells (red arrowheads) following treatment with odanacatib. Percent values represent the number of embryos with the pictured phenotype. n = 75 embryos from 3 experiments. Scale bar: 50 μm. (D) Confocal analyses of embryos stained immunhistochemically for myosin (red) and pSmad1/5/8 (green) show odanacatib treatment increases BMP signaling in MLII embryos. Panels to the right represent higher-power images of boxed regions; white arrowheads denote nuclear localized pSmad1/5/8. Scale bar: 20 μm. (E) Graphs show percent cells containing Smad+ nuclei in WT, gnptab morphant, and odanacatib-treated embryos. n = 20–25 embryos imaged from 3 experiments. Data are presented as mean ± SEM. Student’s t test. **P < 0.01, ***P < 0.001. (F) Confocal images of myl7:RFP+ (labels cardiomyocytes red) and BRE:dsEGFP+ (green) embryos confirm odanacatib treatment improves BMP signaling in MLII embryos. Data quantified in Supplemental Figure 2. n = 10–15 embryos imaged from 2 experiments. Scale bar: 30 μm.

Ctsk deficiency alters valve and myocardial development.

(A) Confocal images of tie2:EGFP embryos treated with odanacatib show alterations in both myocardia (red) and valves (green). In particular, the atria of Ctsk-inhibited hearts are smaller, and the valve cells are less organized. The white line denotes the defined layers present in the WT valve. Percent values represent the number of animals exhibiting these phenotypes. n = 20 embryos from 3 independent experiments. Scale bar: 30 μm (left panels) and 10 μm (right panels). (B) Quantification of the number of control and odanacatib-treated embryos whose hearts “loop” and valves open and close (“clap”) at regular intervals. Each dot represents an experiment with 25 embryos, with 100 total embryos scored. (C) The cross-sectional area of the ventricles and atria is shown from n = 15–20 embryos. Data are presented as mean ± SEM; **P < 0.01,***P < 0.001 by 2-tailed Student’s t test or Dunnett’s corrected test (denoted by red box). V, ventricle; A, atrium. (D) In situ analyses of notch1b expression show reduced expression in AV valves of odanacatib-treated embryos (red arrow heads). Percent values represent the number of animals exhibiting these phenotypes. n = 30 embryos from 3 independent experiments. Scale bar: 50 μm. (E) Schematic depicts TALEN targeted sequences in ctsk, resulting INDELS, and genotyping strategy. Black arrowheads denote position of genotyping primers. (F) Restriction enzyme–based genotyping of PCR amplified samples that were left “uncut” (UC) or “cut” with the HaeIII restriction enzyme. (G) Confocal images of WT and ctsk mutants stained immunohistochemically for myosin (using MF20, red) show reduced size of atria in embryos homozygote for the 2 bp–deleted allele. Percent values represent the number of animals exhibiting these phenotypes. n = 30 embryos imaged from 3 independent experiments. Scale bar: 30 μm. (H) quantification of cross-sectional area of ventricles and atria in WT and ctsk-compromised embryos. Data are presented as mean ± SEM. ***P < 0.001, ****P < 0.0001 using 2-tailed Student’s t test or Dunnett’s corrected test (denoted by red box). (I) In situ analyses of notch1b expression show its boundary is expanded in AV and OFT valves (white arrowheads) of ctsk2bp/2bp embryos (red arrow heads). Percent values represent the number of animals exhibiting these phenotypes. n = 25–30 embryos from 3 independent experiments. Scale bar: 50 μm.

Forcing Ctsk hypersecretion disrupts heart and valve development.

(A) Schematic illustrates Gal4-UAS bipartite expression system, which restricts expression of Flag-tagged Ctsk to either myocardial (driven by myl7:GAL4) or endocardial (driven by fli1a:GAL4) cells. (B) Immunoblotting with anti-Flag antibodies for 1:WT, 2:N216Q, 3: C139S;N216Q Ctsk transgenes in gal4or gal4+ embryos show each is expressed and reveals increased protein stability and processing of hypersecreted (N216Q) Ctsk variant (red arrows denote cathepsin K) (C) Analyses of Ctsk activity in pools of 15 embryos show that, like MLII embryos, expression of the N216Q-secreted variant is associated with more enzyme activity than induction of the WT Ctsk transgene. Data are presented as mean ± SEM. **P < 0.01. ***P < 0.001 using Dunnett’s test (denoted by red box). n = 4 experiments. (D) Confocal analyses of sections of embryos expressing WT or N216Q-secreted forms of Ctsk stained for the transgene (red) and extracellular matrix (WGA, blue) show WT Ctsk is retained within cells (as it is distinct from WGA stain), while the N216Q variant is secreted. This is illustrated by overlap with extracellular WGA (white arrowheads). Panels 1, 2, and 3 represent higher-power views of regions of interest. (E) Confocal analyses of 4 dpf hearts in progeny of fli1a:gal4 and UAS:ctsk parents expressing either WT, N216Q-, or C139S;N216Q-secreted forms of Ctsk. The genotype with regard to gal4 (+ or –) and ctsk is denoted on each panel. Embryos are cmlc2:EGFP+ (green) and stained immunohistochemically for myosin (red). Images show forcing secretion of Ctsk (N216Q) from endocardial cells does not alter heart morphology, although atria are often slightly smaller. (F) Confocal analyses of 4 dpf hearts in progeny of myl7:gal4 and UAS:ctsk parents. The genotype of gal4 (+ or –) and ctsk (WT, N216Q, or C139S;N216Q) is denoted. Images show that forcing secretion of Ctsk (N216Q) from myocardial cells alters heart morphology. n ≥ 30 embryos from 4 experiments. Scale bar: 20 μm. (G and H) In situ analyses of notch1b in animals expressing WT or a cathepsin K variants (N216Q or C139S;N216Q) secreted from endocardia (G, fli1a:gal4) or myocardia (H, myl7:gal4) show secreting active Ctsk from either tissue impairs valve cell differentiation (arrow heads versus expanded arrows). Control animals are gal4. Percent values represent the number of animals exhibiting phenotypes. n = 30–35 embryos from 3 experiments. Scale bar: 50 μm. (I) Schematic summarizing outcomes of Gal4-UAS experiments. V, ventricle; A,atrium.

Acknowledgments
This image is the copyrighted work of the attributed author or publisher, and ZFIN has permission only to display this image to its users. Additional permissions should be obtained from the applicable author or publisher of the image. Full text @ JCI Insight