|
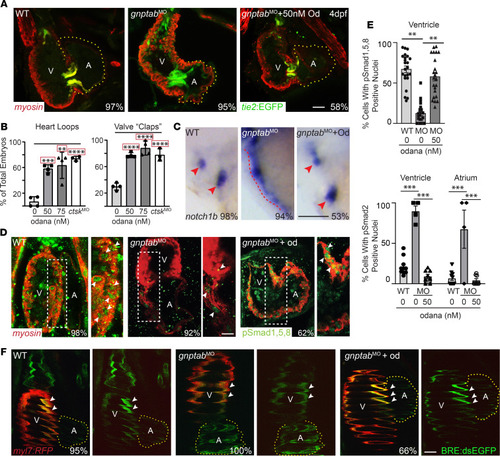
Treatment with the cathepsin K inhibitor odanacatib rescues MLII heart defects.(A and B) Confocal analyses of tie2:EGFP+ (green) hearts stained immunohistochemically for myosin (red) show that treatment with 50 nM odanacatib restores normal morphology to MLII hearts and valves, as assayed by the number of MLII embryos with hearts that loop and valves that open and close (“clap”) at regular intervals following treatment. Percent values on images represent the number of embryos with the pictured phenotype. n = 100–125 embryos. Data are presented as mean ± SEM. **P < 0.01,***P < 0.001, ****P < 0.0001 using Dunnett’s test with correction (indicated by red box). Each dot represents the average of 20–25 embryos from 4–5 experiments. Scale bar: 25 μm. (C) In situ analyses of notch1b expression show restored differentiation of MLII valve cells (red arrowheads) following treatment with odanacatib. Percent values represent the number of embryos with the pictured phenotype. n = 75 embryos from 3 experiments. Scale bar: 50 μm. (D) Confocal analyses of embryos stained immunhistochemically for myosin (red) and pSmad1/5/8 (green) show odanacatib treatment increases BMP signaling in MLII embryos. Panels to the right represent higher-power images of boxed regions; white arrowheads denote nuclear localized pSmad1/5/8. Scale bar: 20 μm. (E) Graphs show percent cells containing Smad+ nuclei in WT, gnptab morphant, and odanacatib-treated embryos. n = 20–25 embryos imaged from 3 experiments. Data are presented as mean ± SEM. Student’s t test. **P < 0.01, ***P < 0.001. (F) Confocal images of myl7:RFP+ (labels cardiomyocytes red) and BRE:dsEGFP+ (green) embryos confirm odanacatib treatment improves BMP signaling in MLII embryos. Data quantified in Supplemental Figure 2. n = 10–15 embryos imaged from 2 experiments. Scale bar: 30 μm.
|

