FIGURE SUMMARY
Title

Cell type specific gene expression profiling reveals a role for complement component C3 in neutrophil responses to tissue damage

Authors
Houseright, R.A., Rosowski, E.E., Lam, P.Y., Tauzin, S.J.M., Mulvaney, O., Dewey, C.N., Huttenlocher, A.
Source
Full text @ Sci. Rep.

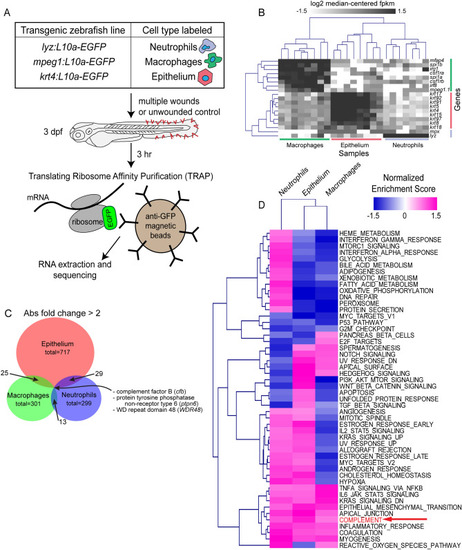
TRAP-RNAseq identifies differential expression of genes by neutrophils, macrophages, and epithelial cells in response to wounding. (A) Experimental setup. 3 dpf transgenic zebrafish larvae expressing an EGFP-tagged copy of the ribosomal subunit L10a specifically in neutrophils (lyz), macrophages (mpeg1), or epithelium (krt4) were subjected to multiple fin tissue wounds. 3 h later, larval tissue was homogenized and ribosomes were isolated with α-GFP immunoprecipitation. RNA was then extracted and subject to Illumina sequencing. (B) Expression of a priori tissue-specific genes across all analyzed samples. Columns represent samples, labeled by cell type-specific promoter used; rows represent known cell-type-specific genes. (C) Venn diagram of genes found to be more than twofold changed by wounding in each cell type. (D) Normalized enrichment scores of Molecular Signatures Database Hallmark Gene Sets (rows) in each cell type (columns), from Gene Set Enrichment Analyis (GSEA).

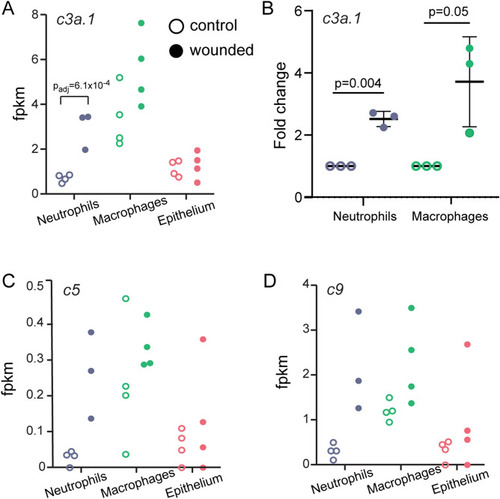
TRAP-RNAseq identifies upregulation of the complement pathway and c3a.1 in response to wounding. (A) Expression measured by RNA-seq (fpkm) of complement pathway gene c3a.1 across all three cell types. Each dot represents one replicate. (B) RT-qPCR validation of c3a.1 gene expression in neutrophils and macrophages. Each dot represents one replicate; measurements for each replicate were performed in triplicate. Data is expressed as the fold change in mean Cq, normalized to ef1a expression and expression of c3a.1 in unwounded controls. N = 200 larvae/condition/replicate. C, D. Expression measured by RNA-seq (fpkm) of complement pathway genes c5 (C) and c9 (D), across all 3 three cell types. Each dot represents one replicate.

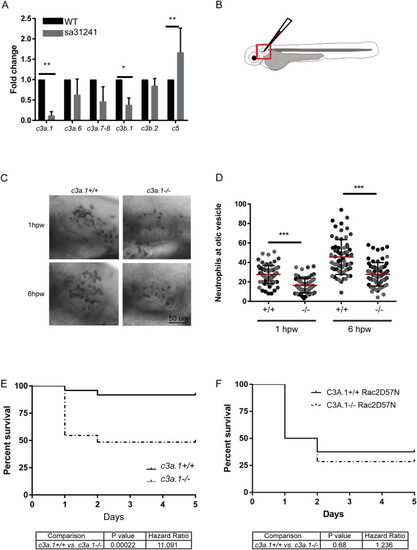
Global depletion of c3a.1 decreases neutrophil recruitment to, and subsequent survival of, localized bacterial infection. (A) RT-qPCR validation of c3a, c3b, and c5a orthologue expression in pooled WT and c3a.1−/− (sa31241) whole zebrafish larvae, normalized to WT expression for each gene and to ef1α, with data expressed as mean + /- SEM. Data comprise 3 independent experiments, performed in triplicate, n = 50 larvae per condition per experiment. (B) Experimental setup. c3a.1+/+ (n = 71, 1 hpw; 65, 6 hpw) and c3a.1−/− (n = 71, 1 hpw; 68, 6 hpw) larvae were inoculated with 1000 CFU Pseudomonas aeruginosa in the left otic vesicle and subsequently stained with Sudan Black B. The otic vesicle region (box) was imaged. (C) Representative images and (D) quantification of neutrophil recruitment following otic vesicle infection, with data expressed as mean + /- SEM. Each dot represents one larva; colors represent results of 3 independent experiments. ***p < 0.001 (E) c3a.1+/+ (n = 24) and c3a.1−/− (n = 32) larvae were infected with 7500 CFU Pseudomonas aeruginosa in the left otic vesicle and survival was tracked over 5 days post-infection. (F) To test whether survival was neutrophil-dependent, c3a.1+/+ (n = 16) and c3a.1−/− (n = 14) larvae with neutrophils that are mcherry-labeled and carry a mutation in rac2 rendering them migration-defective (Tg(mpx:rac2D57N-mcherry)) were infected with Pseudomonas aeruginosa as in C and survival was tracked over 5 days post-infection. E and F each comprise 3 independent experiments.

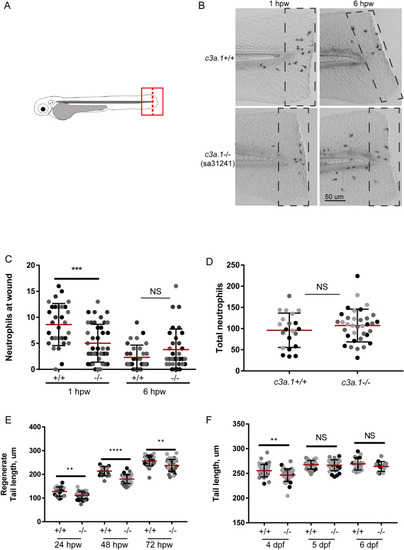
Global depletion of c3a.1 decreases early neutrophil recruitment to a wound. (A) Experimental setup. 3 dpf c3a.1+/+ or c3a.1−/− zebrafish larvae were subjected to wounding by tail transection (dashed line), subsequently stained with Sudan Black B, and the tail region (box) was imaged. (B) Representative images and (C) quantification of neutrophil recruitment following tail transection in c3a.1+/+ (n = 31, 2 hpw; 32, 8 hpw) and c3a.1-/- (n = 41, 2 hpw; 33, 8 hpw) larvae. (D) Quantification of total neutrophil counts in c3a.1+/+ (n = 21) and c3a.1−/− (n = 35) larvae. (E) Quantification of caudal fin regenerate length following tail transection, 24 hpw-72 hpw, of c3a.1+/+ (n = 20, 24 hpw; 20, 48 hpw; 36, 72 hpw) and c3a.1−/− (n = 39, 24 hpw; 40, 48 hpw; 36, 72 hpw) larvae. (F) Quantification of caudal fin length during larval development, 4dpf-6dpf, of c3a.1+/+ (n = 40, 4dpf; 40, 5dpf; 19, 6dpf) and c3a.1−/− (n = 36, 4dpf; 34, 5dpf; 13, 6dpf) larvae. For CF, all data are expressed as mean + /− SEM; each dot represents one larva; colors represent results of 3 independent experiments. *p < 0.05, **p < 0.01, ***p < 0.001, ****p < 0.0001.

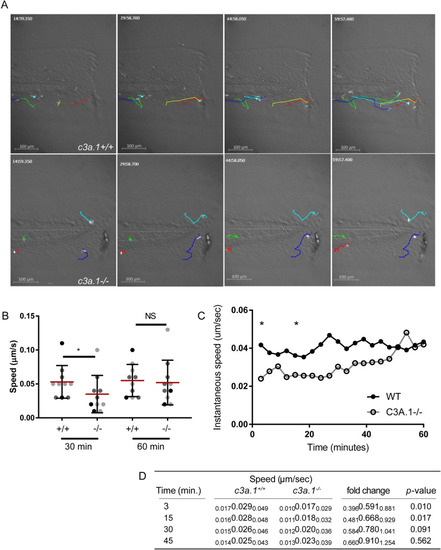
Loss of c3a.1 impairs neutrophil recruitment by decreasing neutrophil migration speed early after wounding. (A) Time-lapse photomicrographs of neutrophil recruitment to tail-transected caudal fins of c3a.1+/+ (n = 8) or c3a.1−/− larvae (n = 8) with mcherry-labeled neutrophils (Tg(mpx:mcherry)), 0–60 min post-wound, showing tracks of forward migrating neutrophils. Images with track overlay were generated using the MTrackJ plugin68 in ImageJ69 (B) Quantification of mean track speed of forward-migrating neutrophils, expressed as mean + /- SEM. Each dot represents the mean of the first 5 neutrophils recruited to the wound of an individual larva. Colors represent the results of 4 independent experiments. *p < 0.05 (C) Graph, expressed as mean, and (D) quantification of instantaneous speed of all forward-migrating neutrophils over the first 60 min following wounding. In (D), for speed and fold change, data are expressed as median (center values), with 95% confidence intervals (small print). Data comprise 4 independent experiments. *p < 0.05.

Acknowledgments
This image is the copyrighted work of the attributed author or publisher, and ZFIN has permission only to display this image to its users. Additional permissions should be obtained from the applicable author or publisher of the image. Full text @ Sci. Rep.