- Title
-
MondoA regulates gene expression in cholesterol biosynthesis-associated pathways required for zebrafish epiboly
- Authors
- Weger, M., Weger, B.D., Schink, A., Takamiya, M., Stegmaier, J., Gobet, C., Parisi, A., Kobitski, A.Y., Mertes, J., Krone, N., Strähle, U., Nienhaus, G.U., Mikut, R., Gachon, F., Gut, P., Dickmeis, T.
- Source
- Full text @ Elife
|
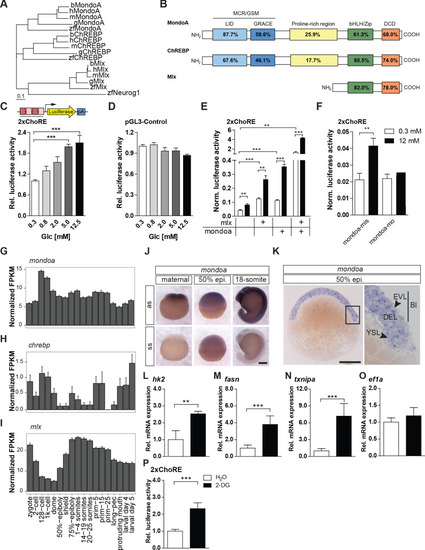
(A) Phylogenetic tree of ChREBP, MondoA and Mlx proteins. h, human, m, mouse, b, bovine, g, chicken, zf, zebra?sh. Outgroup: zf Neurogenin 1 (Neurog 1). Scale bar: 0.1 estimated amino acid substitutions per site. (B) Amino acid identities in % between zebra?sh and human domains of ChREBP, MondoA and Mlx: ?Mondo conserved regions/glucose-sensing module? (MCR/GSM); ?low-glucose inhibitory domain? (LID; light blue); ?glucose-response activation conserved element? (GRACE; dark blue); ?basic-helix-loop-helix/leucine zipper? (bHLH/ZIP; green); ?dimerization and cytoplasmic localization domain? (DCD; red). (C, D) Bioluminescence levels after 24 hr of glucose treatment of PAC2 cells transiently transfected with the 2xChoRE reporter consisting of a luciferase reporter gene (yellow) regulated by a minimal promoter (TATA; arrow) and two carbohydrate response elements (ChoREs; each with the sequence 5?-CACGCG-N5-CTCGTG-3?; pA for polyadenylation site; n = 4, (C) or with the constitutively expressed pGL3-Control reporter construct (D, n = 4). (E, F) Bioluminescence levels in 2xChoRE reporter expressing PAC2 cells upon 24 hr of treatment with 0.3 mM (white bars) or 12 mM (black bars) glucose after overexpression of MondoA and/or Mlx (E, n = 4) or transfection with mondoa-mo or mondoa-mis (F, n = 8). Data were normalized to Renilla luciferase activity (Norm. bioluminescence). (G?I) mRNA expression pro?les of mondoa (G), chrebp (H) and mlx (I) during zebra?sh developmental stages from zygote to larval stage five extracted from a published dataset (White et al., 2017). n = 20; FKPM, Fragments Per Kilobase of transcript per Million mapped reads. (J) WISH of mondoa transcripts at zygote (maternal), 50% epiboly (50% epi.) and 18-somite stages. as, antisense probe, ss, sense probe. Scale bar: 0.2 mm. (K) Epon sections of 50% epi. embryos showed mondoa expression in the enveloping layer (EVL), the deep cell layer (DEL) of the blastoderm (Bl) and the yolk syncyctial layer (YSL). Scale bar: 0.2 mm, for higher magnification 50 µm. (L?O) Glucose induction of Mondo pathway target gene expression in early zebrafish embryos. Embryos were injected with the glucose analog 2-deoxy-D-glucose (2-DG; black bars) or with water (white bars) as a control. RNA was extracted at the sphere stage to perform RT-qPCR of genes known to be Mondo pathway targets in mammals: hexokinase 2 (hk2, L), fatty acid synthase (fasn, M), thioredoxin-interacting protein a (txnipa, N), eukaryotic translation elongation factor 1 alpha 1 (ef1a, O) (n = 9). (P) Embryos (n ? 72) injected with the 2xChoRE reporter showed increased bioluminescence at sphere stage when co-injected with 2-DG. Error bars represent SEM; *, p?0.05; **, p?0.01; ***, p?0.001. |
|
( |
|
(A, B) Dose-dependent (0.25?2.0 mM) arrest of epiboly movements of mondoa morphants when the uninjected control was around bud stage (~10 hpf). (A) Images of representative embryos. (B) Quanti?cation of phenotypes scored when uninjected embryos had accomplished epiboly: ?unaffected?, embryos reached bud/3 somite stage in parallel with controls; ?affected?, developmental arrest at an earlier epiboly stage; ?dead?, coagulated embryos. Percentages of ?affected? embryos were: uninjected (n = 0/26; 0%), 0.25 mM (n = 2/23; 8.7%), 0.5 mM (n = 15/24; 62.5%), 1 mM (n = 17/18; 94.4%), 2 mM (n = 39/41; 95.1%). (C) Developmental time course upon mondoa knockdown compared to uninjected embryos at the sphere stage (~4 hpf), the 60% epiboly (~7 hpf) and the 3-somite stage (~11 hpf). When uninjected control embryos were at the 3-somite stage, the epiboly delay/arrest phenotype was observed with mondoa-mo and with a MO targeting mlx (mlx-mo). No effect on epiboly was observed in embryos injected with mondoa-mis MO. (D) Quanti?cation of the phenotypes in (C), scored when uninjected embryos were at the bud stage. Percentages of ?affected? embryos : uninjected, 0% (n = 0/403); mondoa-mis, 2.8% (n = 3/109); mondoa-mo, 95.3% (n = 462/485); mlx-mo, 90.5% (n = 124/137). (E) Partial rescue of mondoa knockdown with mondoa mRNA. Percentage of epiboly progression was determined via no tail (ntl) WISH. Uninjected control embryos (n = 30) were ?xed at the 75% epiboly stage along with the morphants. Embryos co-injected with mondoa-mo and mondoa mRNA (250 ng/µl) were partially rescued (n = 20) compared with mondoa-mo alone injected embryos (n = 25). Scale bar: 0.2 mm. Asterisks label the blastoderm margin, arrowhead indicates germ ring/shield-like thickening. Error bars = SEM; *, p?0.05; **, p?0.01; ***, p?0.001. hpf, hours post fertilization. PHENOTYPE:
|
|
( |
|
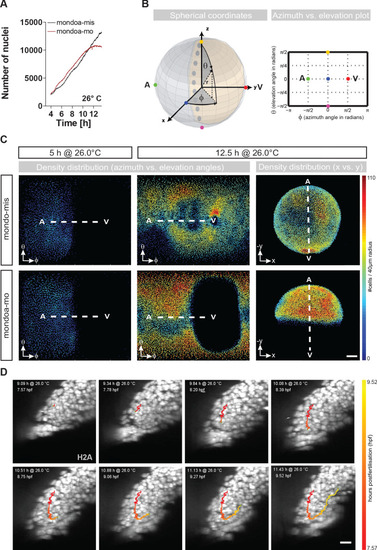
(A) Nuclei numbers over time in hours of mondoa-mis (black trace) and mondoa-mo (red trace) injected Tg(h2afva:h2afva-GFP) embryos. (B) Scheme illustrating the transformation of Cartesian coordinates of nuclei positions extracted from the DSLM image data into a two-dimensional plot of azimuth vs. elevation angles. For details, see Materials and methods section. (C) Cell density plots of mondoa-mis and mondoa-mo injected embryos after 5 and 12.5 hr of imaging using an azimuth vs. elevation angle plot to unwrap the embryos. For comparison, a projection of x and y Cartesian coordinates is also shown for the 12.5 hr data. Cell density is color-coded (number of cells/40 µm radius). (D) DSLM time lapse video stills from Video 5 of a morphant embryo. The trace of a single cell determined by automated cell nucleus tracking is highlighted (red to yellow). Scale bar, 20 µm. PHENOTYPE:
|
|
( |
|
(A, B) Confocal images of Tg(h2afva:h2afva-GFP) embryos injected with mondoa-mo (B, n = 5) and uninjected controls (A, n = 5). Arrow: disordered YSL nuclei. YCL, yolk cytoplasmic layer, Bl, blastoderm. Scale bar: 100 µm. (C) Distribution of MOs upon injection at the zygote or 1 k-cell stages, as indicated in the schematic. Injection of mondoa-mo together with a lissamine-tagged fluorescent MO of unrelated sequence (tagged-mo) into the yolk of 1 cell stage eggs leads to fluorescence in the entire embryo, whereas injection of the MOs into the yolk cell of the 1 k-cell stage embryos limits fluorescence to the YSL. (D) Embryos injected at the 1 k-cell stage with the indicated MOs shown when the uninjected control (n = 29/29, 100%) was at bud stage. All mondoa-mo injected embryos were arrested in epiboly (~75% epiboly stage; n = 9/9, 100%), while embryos injected with tagged-mo alone were unaffected (n = 12/12, 100%). Scale bar: 0.2 mm. Asterisks label the blastoderm margin. hpf, hours post fertilization. PHENOTYPE:
|
|
( |
|
(A) Plot of the moderated log2 fold change (mondoa-mo vs. mondoa-mis injected embryos) over averaged normalized counts. The most downregulated gene nsdhl is indicated. (B) The main steps in the conversion of acetyl coenzyme A (acetyl-CoA) to cholesterol and pregnenolone. (C, D) Transcript levels of nsdhl (C) and ef1a (D) of embryos injected with water (white bars) as a control or with the glucose analog 2-deoxy-D-glucose (2-DG; black bars) in the presence (+) or absence (-) of mondoa and mlx mRNA (n = 9). (E) Embryos injected with a splice-site MO against nsdhl (nsdhl-mo) show a severe developmental delay and arrest at ~50% epiboly, when uninjected controls were at bud stage (~10 hpf). (F) Quanti?cation of the experiments in (E). Percentages of ?affected? embryos: uninjected (0/84, 0%), nsdhl-mo injected (n = 136/141, 96.5%). (G) Injection of nsdhl-mo into 1 k cell stage embryos led to arrest at 95% epiboly (n = 11/11, 100%), when uninjected control embryos (n = 15/15, 100%) were at bud stage (10 hpf). (H,I) Percentage of epiboly progression under different treatments determined via no tail (ntl) WISH. (H) Uninjected control embryos (n = 30) were ?xed at the 75% epiboly stage along with the treated embryos. Treatment with 20 µM pregnenolone (P5) led to a partial rescue of the mondoa morphants (n = 19), which achieved 48% epiboly (untreated morphants: 38% epiboly; n = 25). Control and mondoa-mo morphant results are reproduced from Figure 2E, as these experiments were carried out in parallel. (I) P5 treatment also led to a partial rescue of the nsdhl morphants (n = 30, 74.6% epiboly compared to 59.0% in untreated morphants, n = 50). Asterisks label the blastoderm margin. Scale bar: 0.2 mm. Error bars represent SEM; *, p?0.05; **, p?0.01; ***, p?0.001. EXPRESSION / LABELING:
PHENOTYPE:
|
|
( |
|
( |
|
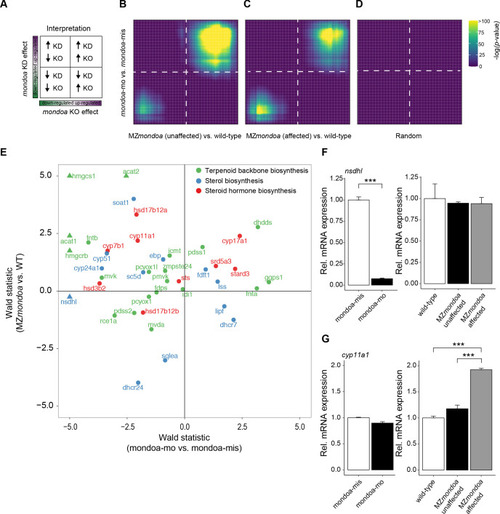
(A) Genetic disruption of the mondoa (mlxip) locus in zebrafish led to a 5 bp deletion in exon three causing a frameshift in the coding sequence and a predicted premature stop. (B) Representative images of zygotic homozygous mutants (ZmondoaKa405) and maternal-zygotic mutants (MZmondoaKa405). (C) Quanti?cation of epiboly phenotypes. On average 5.09 ± 1.25% of MZmondoa mutants (n = 249/5119 embryos) showed an aberrant epiboly phenotype compared to 0.10 ± 0.07% in wild-type (WT; n = 1/1016 embryos) and 0.71 ± 0.39% in Zmondoa mutant embryos (n = 3/549 embryos). (D) MZmondoa mutants exhibited resistance to epiboly perturbance caused by mondoa-mo, confirming specificity of the morphant phenotype (n = 3, ?18 embryos/replicate and condition, treatment/genotype combinations blinded for analysis). (E?H) RNA-seq gene expression analysis in mondoa-mo vs. mondoa-mis injected embryos (n = 3, ?20 embryos/replicate) and MZmondoa mutants vs. WT embryos (n = 3, 8?10 embryos/replicate). (E) Differential gene expression of mondoa, chrebp and mlx in morphants and MZmondoa mutants with (affected) and without (unaffected) aberrant epiboly phenotype. (F) Heatmap illustrating the statistical overrepresentation of pathway associations for morphant (mondoa-mo vs. mondoa-mis) or mutant embryos (MZmondoa vs. WT) affected or unaffected in epiboly. (G). Overlaid barcode plots illustrating the enrichment for differential gene expression compared to controls for terpenoid backbone biosynthesis genes. MZ mondoa mutants with unaffected epiboly (black) display a coordinated upregulation of genes associated with terpenoid biosynthesis. MZmondoa mutants that are affected in epiboly (green) lack this coordinated upregulation. Error bars represent SEM; *, p?0.05; **, p?0.01; ***, p?0.001. PHENOTYPE:
|
|
Barcode plots illustrating the enrichment for sterol biosynthesis ( |
|
( |


