- Title
-
Family-based exome sequencing and case-control analysis implicate CEP41 as an ASD gene
- Authors
- Patowary, A., Won, S.Y., Oh, S.J., Nesbitt, R.R., Archer, M., Nickerson, D., Raskind, W.H., Bernier, R., Lee, J.E., Brkanac, Z.
- Source
- Full text @ Transl Psychiatry
|
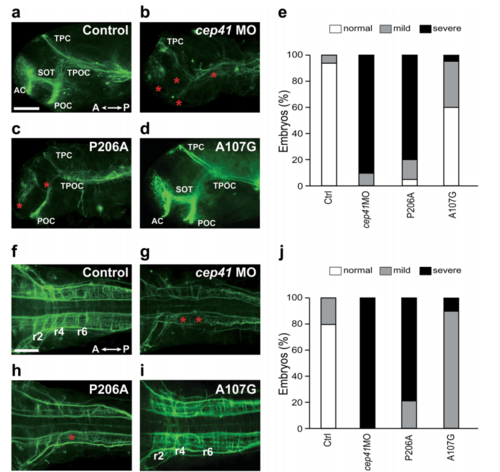
a–d Axon tracts of the forebrain in zebrafish microinjected with cep41 MOs or human CEP41 mRNAs as indicated in each panel. The axons immunostained with anti-acetylated α-Tub antibodies at 35 hpf were imaged by fluorescence microscopy. AC anterior commissures, POC post optic commissure, SOT supra optic tract, TPOC tract of the post optic commissure, TPC tract of the posterior commissure. Asterisks indicate reduced and disorganized axons. Scale bar is 100 µm. e Quantified data by counting zebrafish embryos with forebrain axonal defects. The severity of defective axons is distinguished as the numbers of malformed axonal tracts. Mild: 1–2 axonal defects. Severe: 3–5 axonal defects. f–i Axon tracts of the hindbrain in MOs or mRNA-injected zebrafish. r2, r4 and r6 are rhombomere 2, 4 and 6. Asterisks indicate defective axons and scale bar is 100 µm. j Quantified data by counting zebrafish embryos with hindbrain axonal defects. The severity of defected axons is distinguished as the numbers of abnormal axons. Mild: 1–6 axonal defects. Severe: 7–10 axonal defectsPHENOTYPE:
|
|
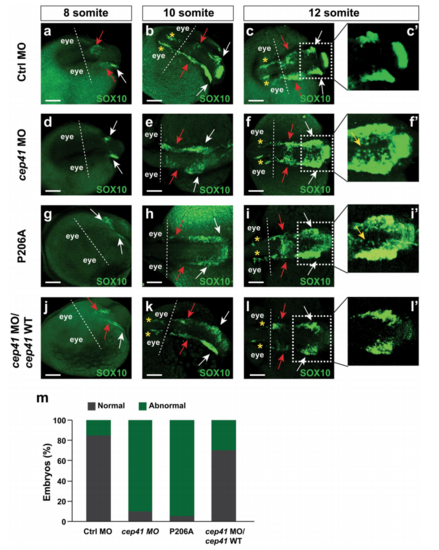
Analysis of migration of CNC cells in the control MO (a–c), cep41 MO (d–f), P206A (g–i) and cep41 MO+ zebrafish cep41 mRNA (j–l)-injected zebrafish at 8, 10 and 12 somite stages. Asterisks, red arrows and white arrows indicate migrating CNC cells in the forebrain, midbrain and hindbrain, respectively. The extent of medial expansion of CNC cells (yellow arrows, zoomed in area) was compared in the hindbrain of each zebrafish (c′, f′, i′, l′). m. All data are representative of at least five independent experiments. The quantified data of zebrafish with defective CNC cell migration are graphically presented (20 embryos/counting). Abnormal: either delayed migration or medial expansion of CNC cells EXPRESSION / LABELING:
PHENOTYPE:
|
|
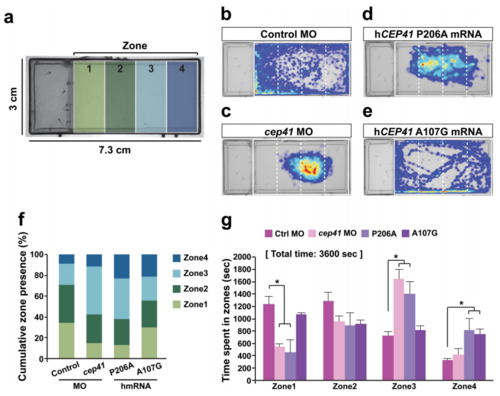
a A diagram of experimental chamber indicating the zones for the analysis of target location. b–e Heatmap showing the cumulative location of each 5–6 dpf control MO, cep41 MO and human CEP41 P206A and A107G mRNA injected target zebrafish larvae during 1 h experiment. f Quantified data presenting the percentage of time spent in each zone during 1 h experiment. g The statistical analysis of the time target larvae spent in each zone. The cep41 MO and P206A larvae spend decreased amount of time in zone 1 adjacent to the group. The data are shown as the mean ± SD; *p < 0.05 (Student’s t-test). All data are representative of at least five independent experiments |

ZFIN is incorporating published figure images and captions as part of an ongoing project. Figures from some publications have not yet been curated, or are not available for display because of copyright restrictions. PHENOTYPE:
|


