- Title
-
Using zebrafish to study the function of nephronophthisis and related ciliopathy genes
- Authors
- Molinari, E., Ramsbottom, S.A., Sammut, V., Hughes, F.E.P., Sayer, J.A.
- Source
- Full text @ F1000Res
|
Staging embryos by somite counting. A schematic (A) and light-microscopy image (B) showing a lateral view of a 10 somite stage zebrafish embryo. The most anterior somite (red arrow) is slightly shorter and broader than more posterior somites. The generation of somites is tightly linked to the overall development of the embryo and therefore allows for accurate aging. e, eye; kv, Kupffer?s vesicle; ov, otic vesicle; s, somites; tb, tail bud. |
|
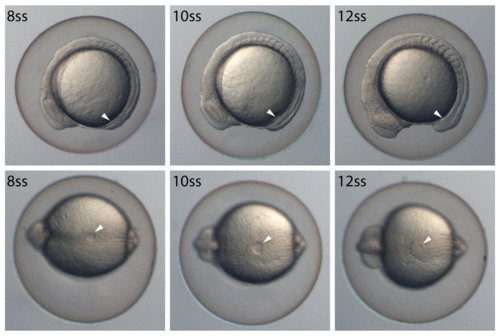
Kupffer?s vesicle changes significantly in a short developmental window. Lateral (top panels) and ventral (bottom panels) views of zebrafish from the 8 somite stage (ss) to the 12 ss. Over this developmental window, Kupffer?s vesicle (white arrowhead) expands and then shrinks, reaching its greatest size at the 10 ss. At 28.5°C, zebrafish will form approximately two somites per hour, so the above panels represent a 4-hour period. |
|
Mounting samples for visualization of Kupffer?s vesicle. Schematic showing a 10 somite stage zebrafish embryo (A). Forceps can be used as depicted to separate the tail tip from the rest of the embryo. Excess yolk is then removed, and the tail tip mounted flat on to a microscope slide. (B) Bright field image overlaid with fluorescence image of flat-mounted tail tip. The white box depicts the location of Kupffer?s vesicle. Fluorescence from acetylated-? tubulin (red) can be seen within this region. (C) Confocal image of Kupffer?s vesicle, visualised using acetylated-? tubulin (red), aPKC (green) and DAPI (blue). |


