- Title
-
A Forward Genetic Screen in Zebrafish Identifies the G-Protein-Coupled Receptor CaSR as a Modulator of Sensorimotor Decision Making
- Authors
- Jain, R.A., Wolman, M.A., Marsden, K.C., Nelson, J.C., Shoenhard, H., Echeverry, F.A., Szi, C., Bell, H., Skinner, J., Cobbs, E.N., Sawada, K., Zamora, A.D., Pereda, A.E., Granato, M.
- Source
- Full text @ Curr. Biol.
|
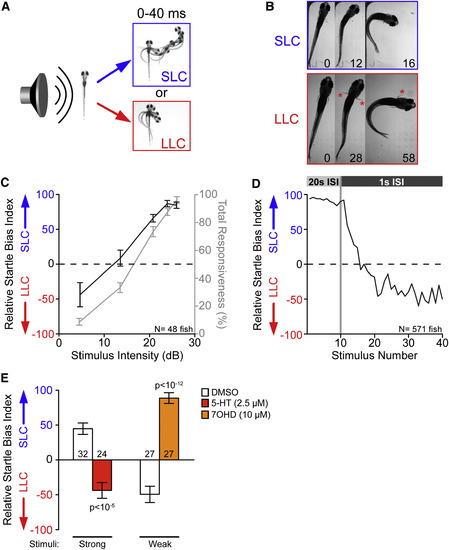
Selection of Appropriate Behavioral Responses to Acoustic Stimuli Is a Dynamic Process (A) Temporal projections over 40 ms post-stimulus of wild-type 5-dpf larvae performing SLC and LLC behaviors. (B) Time course of the initial C-bend of wild-type (WIK) fish performing SLC and LLC responses, 16 dpf. Numbers show elapsed time (in milliseconds) after stimulus; red asterisks indicate active pectoral fin usage. (C) Average behavioral bias (black, left axis) and response frequency (gray, right axis) of 48 larvae (5 dpf) to acoustic stimuli (p < 0.0001, Kruskal-Wallis test). Relative startle bias index was calculated for each larva at each intensity (see STAR Methods). (D) Average relative startle bias of 5-dpf larvae following identical 26-dB stimuli at 20-s intervals (stimuli 1?10) and then 1-s intervals (stimuli 11?40). (E) Average relative startle bias of 5-dpf larvae treated for 20 min with serotonin (5-HT) or dopamine D3 receptor agonist R-(+)-7-Hydroxy-DPAT (7OHD). Numbers of larvae tested are given at base of bars. Error bars indicate SEM. See also Figures S1 and S2, Table S1, and Video S1. PHENOTYPE:
|
|
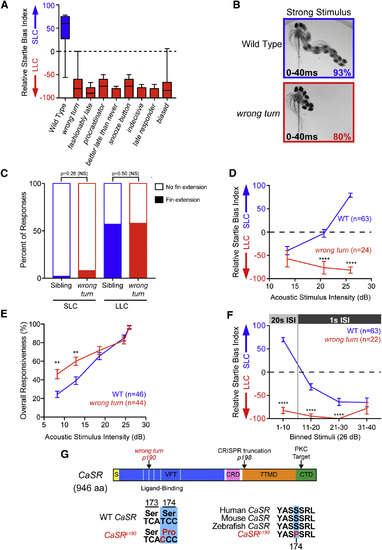
Isolation of Decision-Making Mutants from a Forward Genetic Screen (A) Average startle biases of decision-making mutants, presenting the average bias of the ?bottom 25%? of all tested larvae from heterozygous mutant carrier incrosses (n ? 47 mutant larvae each), with the bottom 25% of representative wild-type larvae (Tüpfel long fin [TLF], indicated in blue; n = 28). (B) Temporal projection over 40 ms post-stimulus (26 dB) of wild-type and wrong turn mutant 5-dpf larval responses. Percentage indicates average frequency observed (30 WT and 58 wrong turn larvae). (C) Percentage of short- and long-latency responses using pectoral fins during the initial C-bend. n = 14 sibling (blue, 250 responses), and n = 14 wrong turn (red, 112 responses), Fisher?s exact test. (D and E) Acoustic stimulus intensity versus average relative startle index (D) or average overall startle responsiveness (E) for wild-type (blue) and wrong turn mutants (red). (F) Average relative startle bias of 5-dpf wrong turn and wild-type larvae following identical 26-dB stimuli at 20-s intervals (stimuli 1?10) and then 1?s intervals (stimuli 11?40). (G) Zebrafish CaSR protein showing locations of the wrong turnp190 and CaSRp198 mutations, Signal Sequence (S, yellow), extracellular Venus Fly Trap domain (VFT, blue), cysteine-rich domain (CRD, pink), 7-pass transmembrane domain (7TMD, orange), C-terminal domain (CTD, green), 5 key residues of the ligand-binding pocket of the VFT hinge (light blue), and PKC phosphorylation residue (arrowhead). Error bars indicate SEM. ??p < 0.01; ????p < 0.0001, Bonferroni-corrected t test. NS, not significant. See also Figures S3 and S4. PHENOTYPE:
|
|
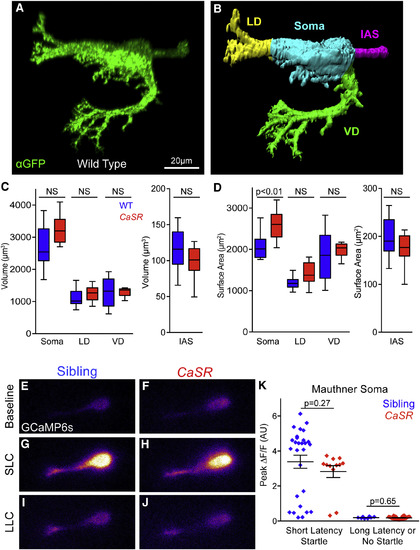
Mauthner Morphology and Function Are Largely Unperturbed in CaSR Mutants (A) Representative projection of wild-type Mauthner-neuron-expressing membrane-targeted gap43-citrine, stained with anti-GFP. Non-Mauthner labeling was thresholded, and neurons were reoriented for clarity. (B) Surface of wild-type Mauthner neuron from (A) segmented into the lateral dendrite (LD, yellow), ventral dendrite (VD, green), initial axon segment (IAS, magenta), and soma (cyan) for morphological quantification. (C and D) Quantification of the volume (C) and surface area (D) of segmented Mauthner neuron regions (n = 15 sibling and 12 CaSR mutant neurons). (E?J) Representative GCaMP6s fluorescence in Mauthner neurons of sibling (E, G, and I) and CaSR mutant (F, H, and J) larvae. Baseline fluorescence immediately prior to stimuli (E and F), and peak fluorescence during SLC (G and H) or LLC (I and J). (K) Peak ?F/F in Mauthner soma during responses of sibling (blue) and CaSR mutant (red) larvae to 13-dB acoustic stimuli. n = 28 sibling SLC responses, 12 CaSR SLC responses, 8 sibling LLC responses, and 26 CaSR LLC responses. Error bars indicate SEM. See also Figure S5 and Table S2. |

ZFIN is incorporating published figure images and captions as part of an ongoing project. Figures from some publications have not yet been curated, or are not available for display because of copyright restrictions. |

ZFIN is incorporating published figure images and captions as part of an ongoing project. Figures from some publications have not yet been curated, or are not available for display because of copyright restrictions. PHENOTYPE:
|

ZFIN is incorporating published figure images and captions as part of an ongoing project. Figures from some publications have not yet been curated, or are not available for display because of copyright restrictions. PHENOTYPE:
|
|
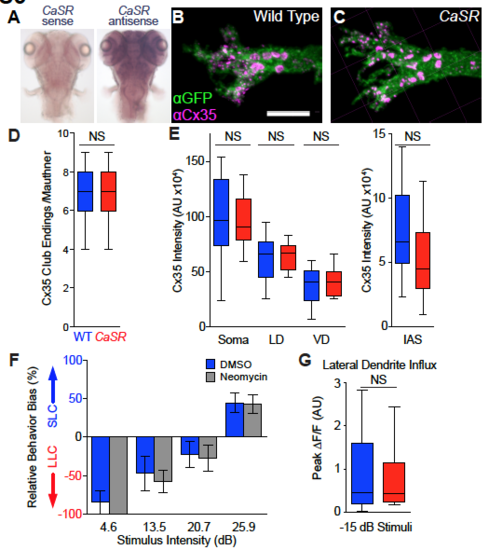
Impact of CaSR on Mauthner neuron synapses and synaptic influx, Related to Figure 3. (A) CaSR antisense probe in situ hybridization shows broad expression through the brain (104 hpf). (B-C) Confocal projection images of 144 hpf wild type sibling (A) and CaSR mutant Mauthner neuron lateral dendrites. Mauthner neurons labeled with Tg(hsp70:GAL4FFDMC)130a; Tg(UAS:gap43-citrine) transgene combination and stained with anti-GFP (?GFP, green) and anticonnexin 35 (?Cx35, magenta). Scale bar indicates 10 ?m. For clarity, labeling in both channels is shown following thresholding through Imaris software to eliminate non-Mauthner staining. (D-E) Quantification of ?Cx35 staining of Mauthner neurons from sibling (blue) and CaSR mutant (red) larvae including counts of large Club Ending synapses (C) and total ?Cx35 intensity on segmented Mauthner neuron surfaces (D). N= 15 wild type siblings and 12 CaSRp190 homozygous mutant neurons analyzed (see also Figure 3). (F) Relative behavioral bias of control larvae (DMSO, blue, N=23) and larvae treated with 40 ?M neomycin (grey, N=13) to ablate lateral line sensory neuromasts, 6 dpf. (G) Peak ?F/F in the Mauthner lateral dendrite following subthreshold acoustic stimuli (-15 dB) in head-restrained sibling (blue, N=29 stimuli) and CaSRp190 mutant (red, N=24 stimuli) larvae expressing GCaMP6s. Statistical comparison by student?s t-test (NS, p=0.395). |


