- Title
-
The dual developmental origin of spinal cerebrospinal fluid-contacting neurons gives rise to distinct functional subtypes
- Authors
- Djenoune, L., Desban, L., Gomez, J., Sternberg, J.R., Prendergast, A., Langui, D., Quan, F.B., Marnas, H., Auer, T.O., Rio, J.P., Del Bene, F., Bardet, P.L., Wyart, C.
- Source
- Full text @ Sci. Rep.
|
Ventral CSF-cNs exhibit an apical extension composed of microvilli and a kinocilium in the spinal cord. (a) Transverse section of the spinal cord showing restricted deposition of DAB in a ventral CSF-cN. (b) Overall view of a DAB+ ventral CSF-cN contacting the central canal (cc) and surrounded by ependymal cells. (c) Ventral CSF-cNs project at the apical pole an extension toward the central canal bearing several microvilli (arrowheads). (d) Within this extension is located a cilium (arrows) with two central microtubule along the axoneme (double arrowhead), suggesting a motile cilium. Large granular vesicles (LGV) are observed in the cytoplasm (e, dotted arrows) and axo-somatic synaptic contacts in the basal pole (f, ASC). Note the symmetry of the synaptic contact (black arrow) is reminiscent of an inhibitory synapse. Note the presence of LGV in the axon (f, dotted arrows). Scale bar?=?10??m (a), 2?µm (b), 1??m (c), 500?nm (d,e) and 400?nm (f). |
|
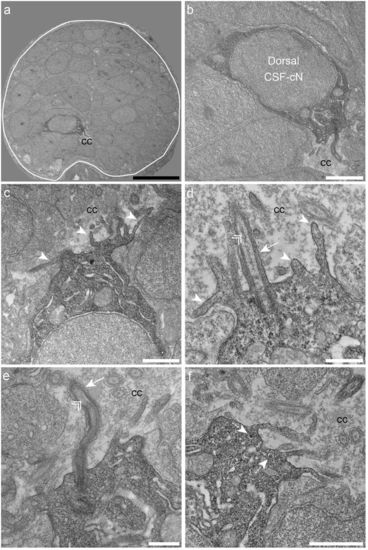
Dorsal spinal CSF-cNs also exhibit ultrastructural properties of sensory neurons. (a) Transverse section of the spinal cord showing restricted deposition of DAB in a dorsal CSF-cN. (b) Overall view of a DAB+ dorsal CSF-cN contacting the central canal (cc). (c,d) Dorsal CSF-cNs bear at the apical pole multiple microvilli (arrowheads). (d,e) In the apical pole is located a cilium (arrow) with two central microtubule singlets along the axoneme (double arrowhead), reminiscent of a motile cilium. (f) Dorsal CSF-cN also exhibit LGV distributed in the cytoplasm (dotted arrows). Scale bar?=?10??m (a), 2??m (b), 1?µm (c,f) and 500?nm (d,e). |
|
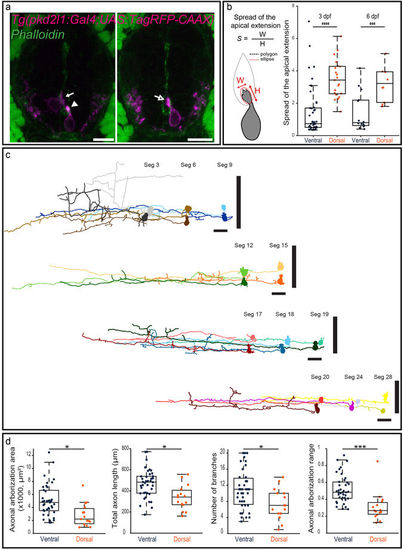
Morphological analysis of CSF-cNs reveals heterogeneous shapes of apical extension and axonal projections. (a) Transverse sections showing ventral and dorsal TagRFP-CAAX+ CSF-cNs (magenta) at 3?dpf reflecting the diversity of morphologies of the apical extension. The apical extension of all dorsal CSF-cNs spreads along the central canal border (arrow) while most ventral CSF-cNs (86.7%) form compact extensions (arrowhead). The small remaining subpopulation of ventral CSF-cNs exhibits the typical spread of dorsal apical extensions (arrow with empty head; Phalloidin staining, green). (b) Schematics of the analysis of the apical extension performed on each cell and statistical analysis comparing the size of the apical extension between ventral and dorsal CSF-cNs at 3?dpf (n?=?45 versus 21) and 6?dpf (n?=?14 versus 10). The apical extension of dorsal CSF-cNs extends more than for ventral CSF-cNs (two-sample t-tests, p?<?5?·?10?7) and this difference persists at later stages (6?dpf, p?<?0.002). (c) The reconstruction from dorsal (light shade) and ventral (dark shade) CSF-cNs from different segments (Seg) illustrates the diversity of axonal morphologies CSF-cNs between the two types along the spinal cord (n?=?11 for each type). Vertical black bars represent the dorso-ventral limits of the spinal cord. Cells are positioned according to their dorso-ventral (D-V) position with dorsal edge set to 1 and ventral to 0. (d) Comparison of ventral and dorsal CSF-cNs for axonal arborization area, total axon length, number of branches and axonal arborization dorso-ventral range (n?=?39 and 15 cells respectively). Ventral CSF-cNs have a wider axonal arborization (p?<?0.003), a longer axon (p?=?0.0014), reach more ventral domains of the spinal cord (p?<?9?·?10?4), and cover a larger dorso-ventral (D-V) range (p?<?2?·?10?4) with more axonal branches (p?<?0.02). Two-sample t-tests were performed to compare the two populations. Scale bar?=?10??m (a) and 20?µm (c). EXPRESSION / LABELING:
|
|
Ventral and dorsal CSF-cNs project onto distinct neuronal populations. (a?d) Z projection stacks showing contact from ventral and dorsal CSF-cNs onto different spinal targets. (a) Lateral view of a ventral CSF-cN (magenta, arrow) contacting 2 CaP motor neurons (identified based on their location within the segment) labelled in green in the Tg(parg mnet2 -GFP) transgenic line (a1,a2, double headed arrows). (b) Dorsal CSF-cN (green, arrowhead) contacting a putative V0-v interneuron (magenta, based on its dorso-ventral and lateral location) in the Tg(vglut2a:DsRed) transgenic line. (c,d) Ventral (c, arrow) and dorsal (d, arrowhead) CSF-cNs (magenta) contact CoPA sensory interneurons (green) labelled in the Tg(tbx16-GFP) transgenic line. Boxes with close-ups highlight contacts between the CSF-cN and its target. Scale bar?=?20?µm (a?d) and 5?µm (a1?d1). EXPRESSION / LABELING:
|
|
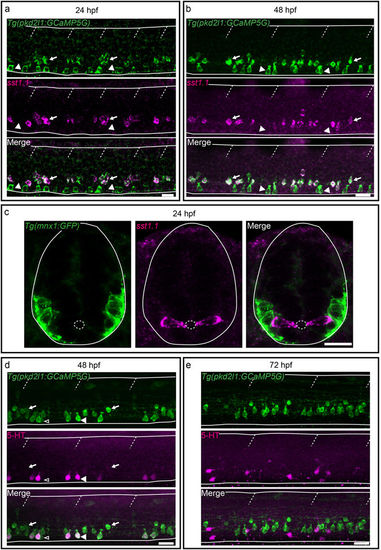
Secreted factors distinguish dorsal and ventral CSF-cNs: while dorsal express the somatostatin paralog sst1.1, ventral CSF-cNs express 5-HT. (a?c) Lateral views of the spinal cord show that sst1.1 expression is restricted to dorsal CSF-cNs (arrows, FISH for sst1.1 (magenta) coupled to GFP IHC (green) on Tg(pkd2l1:GCaMP5G)) (a,b) and Tg(mnx1:GFP) (c) embryos and larvae at 24?hpf (a,c) and 48?hpf (b). (c) Transverse sections show that sst1.1 (magenta) is not expressed in motor neurons (green) as previously suggested (Devos et al.52). (d,e) IHC for 5-HT (magenta) and GFP (green) on Tg(pkd2l1:GCaMP5G) transgenic larvae at 48?hpf (d) and 72?hpf (e). (d) At 48?hpf, most ventral CSF-cNs express 5-HT (arrowhead, compared to negative cells shown with empty arrowhead). Note that dorsal CSF-cNs (arrows) are not labelled by 5-HT. (e) At 72?hpf, ventral CSF-cNs are not serotoninergic anymore in the rostral part of the spinal cord. Horizontal lines represent the limits of the spinal cord and slash dashed lines represent somite boundaries. Small dotted ellipses represent the limit of the central canal. Scale bars?=?20??m. EXPRESSION / LABELING:
|
|
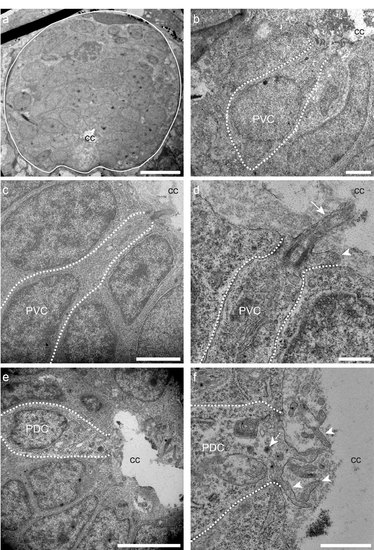
Ultrastructure of putative spinal CSF-cNs in wild type zebrafish larva. (a) Transverse section of the spinal cord illustrating multiple cells around the central canal (cc). (b-d) Putative ventral CSF-cNs referred to as PVC. (d) PVC bearing microvilli (arrowhead) and extending a cilium (arrow) with it apical pole. (e, f) Putative dorsal CSF-cN referred to as PDC extending microvilli (arrowheads) in contact with the central canal (cc). Scale bars: 10 ?m (a), 2 ?m (b, c), 500 nm (d), 5 ?m (e) and 1 ?m (f). |
|
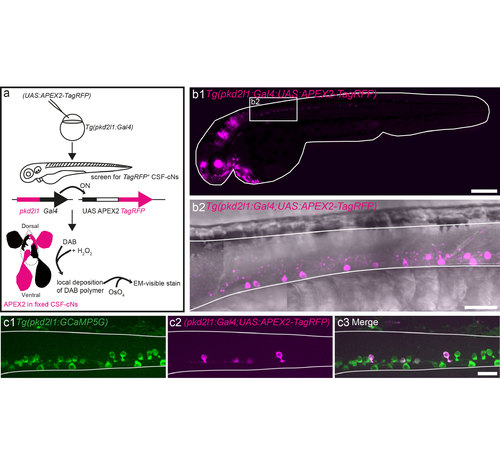
Use of the APEX2 peroxidase combined with the UAS-Gal4 system and pkd2l1 specificity to target CSF-cNs. (a) Schematic showing how APEX2 is used to generate diaminobenzidine (DAB) contrast for EM in zebrafish CSF-cNs taking advantage of the UAS-Gal4 system. We injected the (UAS:APEX2- TagRFP) construct into Tg(pkd2l1:Gal4)icm10 fertilized eggs in order to get specific expression of APEX2 in CSF-cNs. After screening for TagRFP expression, larvae were fixed and bathed with a solution of DAB and H2O2. APEX2 catalyzes the polymerization and local deposition of DAB, which subsequently attracts electron-dense osmium (OsO4), giving EM contrast only in APEX2 expressing structures namely CSF-cNs (ventral and dorsal). (b1) Lateral view of a Tg(pkd2l1:Gal4)icm10 larva at 2.5 dpf injected with (UAS:APEX2-TagRFP) showing that pkd2l1 promoter drives APEX2-TagRFP expression in CSF-cNs within the spinal cord. (b2) Close up of the rostral spinal cord from a lateral view in the same transgenic animal showing the TagRFP expression in CSF-cNs. (c) Co-injection of (pkd2l1:Gal4) and (UAS:APEX2-TagRFP) within Tg(pkd2l1:GCaMP5G)icm07 embryos where all CSF-cNs are labeled (green) demonstrates the variegated expression of TagRFP within CSF-cNs (magenta). Note that in this panel, the expression of TagRFP is restricted in some dorsal CSF-cNs. Scale bars: 300 ?m (b1) and 20 ?m (b2, c). |
|
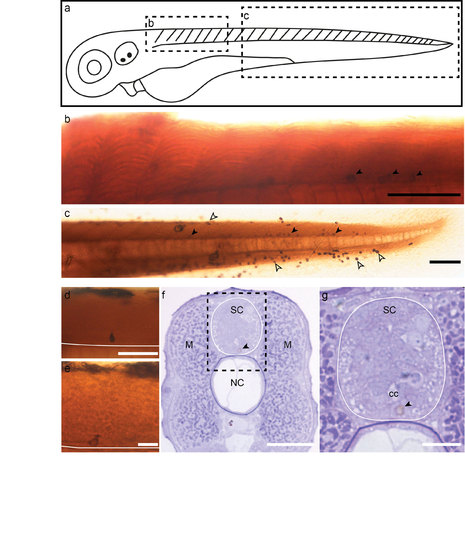
DAB deposition in APEX2 expressing CSF-cNs enables EM contrast in the spinal cord. (a) Scheme of a 2.5 dpf larva showing the regions displayed in b and c. Lateral view of the rostral (b) and caudal (c) spinal cord of 2.5 dpf Tg(pkd2l1:Gal4)icm10 larvae injected with (UAS:APEX2- TagRFP) and revealed by DAB. Note the DAB+ CSF-cNs (arrowheads). (d-e) Close-ups showing that DAB+ cells are CSF-cNs characterized by their peculiar apical extension. White line represents the ventral limit of the spinal cord. (f-g) Transverse section showing in the spinal cord (SC) the specificity of the DAB deposition in a ventral CSF-cN (arrowhead). NC= notochord. (g) Close-up of the dotted rectangle region in (f) showing the DAB signal (purple) in a ventral CSF-cN (arrowhead) below the central canal (cc). Scale bars: 100 ?m (b, c), 50 ?m (d-f) and 20 ?m (g). |
|
Characterization of CSF-cNs axonal morphology (a) Projection obtained from z-stacks of a single CSF-cN in a wild-type larva previously injected with (pkd2l1-TagRFP). (b) The reconstruction of 3 ventral CSF-cNs (dark blue) and 3 dorsal CSFcNs (orange) from segment (Seg) 3, 12 and 19 shows that, along the rostrocaudal axis, ventral CSF-cNs are morphologically different from dorsal ones. (c) Illustration of the reconstruction of one ventral CSF-cN displays the area covered by the axon and the axonal arborization nomenclature. Horizontal lines represent the limits of the spinal cord and slash dashed lines represent somite boundaries. Vertical black bars represent the dorso-ventral limits of the spinal cord, where the ventral edge corresponds to 0 and the dorsal edge to 1. Scale bars = 20 ?m. |
|
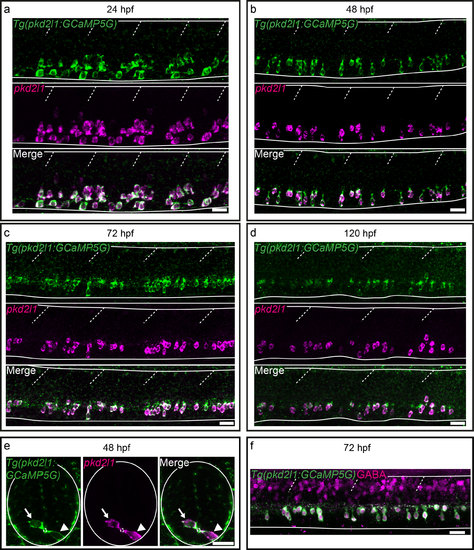
The Tg(pkd2l1:GCaMP5G)icm07 transgenic line recapitulates endogenous pkd2l1 mRNA expression. (a-e) FISH for pkd2l1 (magenta) coupled to GFP IHC (green) on Tg(pkd2l1:GCaMP5G) embryos and larvae at 24 hpf (a), 48 hpf (b, e), 72 hpf (c) and 120 hpf (d). (a-d) Lateral views of the spinal cord from segments 10 to 13 show that all GFP+ cells (green) in the Tg(pkd2l1:GCaMP5G) line are pkd2l1+ (magenta). (e) Transverse sections of the spinal cord of 48 hpf embryos show the dorso-ventral distribution of a ventral CSF-cN (arrowhead) ventral to the central canal (small dotted circle) and a dorsal CSF-cNs (arrow) above it. (f) All CSF-cNs in the Tg(pkd2l1:GCaMP5G) line (green) express GABA (magenta). Horizontal lines represent the limits of the spinal cord and slash dashed lines represent somite boundaries. Scale bars = 20?m. |
|
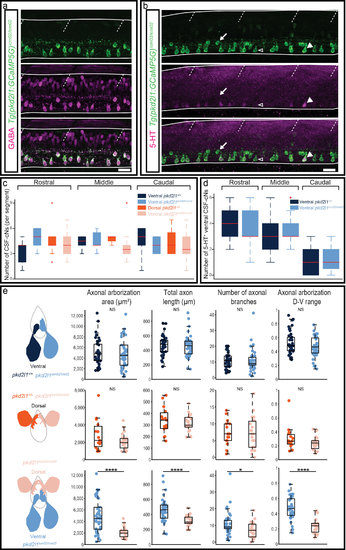
Pkd2l1 is not required for the proper differentiation of spinal CSFcNs GABA (a, magenta), 5-HT (b, magenta) and GFP (a-b, green) IHCs on pkd2l1icm02/icm02 mutants carrying Tg(pkd2l1:GCaMP5G)icm07 (thus named Tg(pkd2l1:GCaMP5G)icm02/icm02). (a) All CSF-cNs in the mutants express GABA at 72 hpf. (b) At 48 hpf, a large proportion of ventral CSFcNs in the mutants express the 5-HT. Horizontal lines represent the limits of the spinal cord and slash dashed lines represent somites boundaries. Scale bars = 20?m. (c-e) pkd2l1+/+ and pkd2l1icm02/icm02 ventral CSF-cNs are represented in two shades of orange from dark to light respectively. pkd2l1+/+ and pkd2l1icm02/icm02 dorsal CSF-cNs are similarly represented in two shades of blue. (c) Counting of the number of ventral and dorsal CSF-cNs in WT and pkd2l1icm02/icm02 larvae at 3 dpf in three regions of the spinal cord; rostral from segments 3 to 6; middle from segments 10 to 13 and caudal from segments 23 to 26. (d) Counting of the number of 5-HT+ ventral CSF-cNs in 48hpf WT and pkd2l1icm02/icm02 embryos. Two-way ANOVAs were performed to test the interaction between the genotypes and the regions were cells were counted. Red lines represent the median and red crosses represent outliers. (e) Statistical analysis of 39 WT and 38 pkd2l1icm02/icm02 ventral CSF-cNs, 15 WT and 23 pkd2l1icm02/icm02 dorsal CSF-cNs, and 38 pkd2l1icm02/icm02 ventral and 23 pkd2l1icm02/icm02 dorsal CSF-cNs comparing the two populations for the axonal arborization area (p ventral WT versus ventral pkd2l1icm02/icm02 = 0.8192; p dorsal WT versus dorsal pkd2l1icm02/icm02 = 0.0956; p ventral pkd2l1icm02/icm02 versus dorsal pkd2l1icm02/icm02 = 2.2 10-5), the total axon length (p ventral WT versus ventral pkd2l1icm02/icm02 = 0.7743; p dorsal WT versus dorsal pkd2l1icm02/icm02 = 0.4241; p ventral pkd2l1icm02/icm02 versus dorsal pkd2l1icm02/icm02 = 8.7 10-5), the number of branches (p ventral WT versus ventral pkd2l1icm02/icm02 = 0.9680; p dorsal WT versus dorsal pkd2l1icm02/icm02 = 0.8210; p ventral pkd2l1icm02/icm02 versus dorsal pkd2l1icm02/icm02 = 0.0242) and the axonal arborization dorso-ventral range (p ventral WT versus ventral pkd2l1icm02/icm02 = 0.1249; p dorsal WT versus dorsal pkd2l1icm02/icm02 = 0.1261; p ventral pkd2l1icm02/icm02 versus dorsal pkd2l1icm02/icm02 = 2.7 10-8). Each dot represents one cell. Two-sample t-tests to compare two populations were performed for the given parameter. |
|
The monosynaptic connection from CSF-cNs on to CaP primary motor neurons is preserved in the pkd2l1icm02/icm02 mutant. (a) Experimental Protocol. Fertilized pkd2l1icm02/icm02 mutant eggs were injected at the one cell stage with both (pkd2l1:Gal4) and (UAS:ChR2-mCherry) DNA constructs. At 3 dpf, larvae were screened for CSF-cNs expressing ChR2-mCherry with the characteristic basket shape found around CSF-cN-innervated CaPs. Simultaneous optogenetic activation of CSF-cN was performed while performing whole-cell patch clamp recordings from the innervated CaP motor neuron. (b) Image of a CSF-cN expressing ChR2-mCherry with characteristic basket formed by CSF-cN axon onto CaP (top), Alexa-filled CaP (middle), merge (bottom). Scale bar= 10 ?m. (c) Light-mediated activation of the CSF-cN induces a monosynaptic IPSC in the recorded CaP motor neuron in a pkd2l1icm02/icm02 mutant (top) similarly to WT conditions 1. Quantification of peak IPSC amplitude in pkd2l1icm02/icm02 (bottom) shows the same range of values than the ones found in WT 1,2 (n = 2 cells). Each dot represents an IPSC event. |


