- Title
-
The somite-secreted factor Maeg promotes zebrafish embryonic angiogenesis
- Authors
- Wang, X., Yuan, W., Wang, X., Qi, J., Qin, Y., Shi, Y., Zhang, J., Gong, J., Dong, Z., Liu, X., Sun, C., Chai, R., Le Noble, F., Liu, D.
- Source
- Full text @ Oncotarget
|
Maeg dynamically expressed in zebrafish developing somite. Expression of maeg was analyzed by whole mount in situ hybridization and whole mount antibody staining. A. 1-cell, lateral view, no staining. B. 30% epiboly, lateral view, no staining. C. 10 hpf, lateral view, no staining. D. 12 hpf, lateral view, arrow indicates somite. D?. 12 hpf, lateral view, arrows indicate somite. E. 15 hpf, lateral view, arrow indicates somite. F. 22 hpf, lateral view, arrow indicates somite. G. 26 hpf, lateral view, arrow indicates somite, square in dash line indicates the magnified region in G?. red line indicates the section position G??, G???. 26 hpf, dorsal view, arrows indicate myotomes. H. 30 hpf, lateral view, arrow indicates somite, square in dash line indicates the magnified region in H?, I. 48 hpf, lateral view, arrow indicates somite, square in dash line indicates the magnified region in I?, J. 60 hpf, lateral view, arrow indicates somite. K. 26 hpf, lateral view, arrowheads indicate somites, arrows indicate somite borders. |
|
maeg loss of function results in the blood vessel morphogenesis defects in zebrafish embryos. A. Confocal imaging analysis of trunk vascular and somital morphology in WT, maeg?/? and maeg morphants Tg(kdrl:EGFP) embryos at 30 hpf. Red and white square brackets indicate the lumen of the DA and PCV, respectively. DA, dorsal aorta; PCV, posterior cardinal vein; and DLAV, dorsal longitudinal anastomotic vessel. B. The statistics of ISV length in WT, maeg?/? and maeg morphants. One-Way ANOVA; ***,P<0.001. C. The statistics of DA and PCV lumen size at 30 hpf. Error bars indicate stdev. |
|
Maeg overexpression causes excessive branching. A. Confocal imaging analysis of trunk vascular morphology in control and maeg/mCherry mRNA mixture injected Tg(kdrl:EGFP) embryos at 48 hpf. Yellow arrowhead indicates the aberrant vessel connected two adjacent ISVs. Blue arrowheads indicate Y-shaped ISVs. B. The statistics of hyperbranching sprouts in maeg up-regulated embryos. C-E. The statistics of ISV, DA and PCV lumen size at 48 hpf. Error bars indicate s.e.m. F. Morphology of subintestinal vessel (SIVs) in 72 hpf Tg(fli1a:EGFP) embryos injected with control mRNA or maeg mRNA. G. The statistics of branch point number. Student?s t-test; ***,P<0.001. H. Quantification of ECs nuclei number in SIVs. Student?s t-test; ***,P<0.001. I. Confocal imaging analysis of ISVs morphology in control and maeg mRNA injected Tg(kdrl:EGFP) embryos at 48 hpf. Red arrowheads indicate knot-like structures. Blue arrowheads indicate angiogenic sprouts. |
|
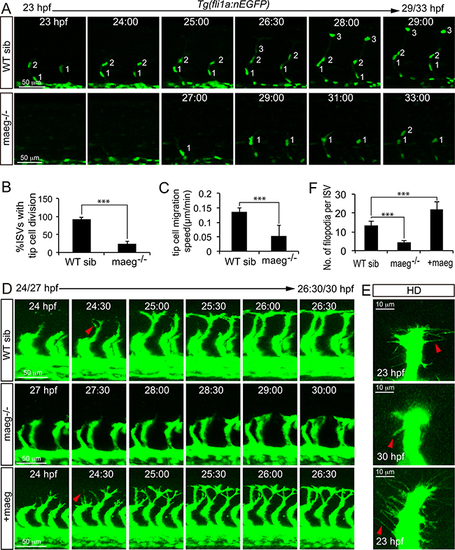
Maeg regulates ISV tip cell behaviors. A. Still images from in vivo time-lapse imaging analysis of WT and maeg?/?Tg(fli1a:nEGFP) embryos. Time (hpf) is noted in the top. Nuclei of ISVs are numbered. B. Percentage of ISVs with tip cell division in control embryos and maeg?/? embryos. Student?s t-test; ***,P<0.001. C. Migration speed of ISV tip cells. Mann Whitney U-test; ***,P<0.001. D. Still images from in vivo time-lapse imaging analysis of ISV tip cell filopodia in Tg(kdrl:EGFP) embryos. Time (hpf) is noted in the bottom. Red arrowheads indicate filopodia extensions. E. Confocal imaging analysis of ISV tip cell filopodia in Tg(kdrl:EGFP) embryos with HD detection setting. Red arrowheads indicate filopodia extensions. F. ISV tip cell filopodia number in per ISVs. One-Way ANOVA; ***, P<0.001. EXPRESSION / LABELING:
PHENOTYPE:
|
|
Maeg regulates angiogenesis dependent on RGD domain. A. The diagram of Maeg protein with RGD domain and Maeg protein with RGD domain mutated to RGE domain (Maeg?RGD). B. Confocal images of ISVs in control embryos, maeg morphants, maeg morphants treated with DAPT, and maeg morphants coinjected with dll4 MO using Tg(kdrl:EGFP) transgenic embryos. C. Percentage of embryos with ISV defect in each group. ?2 test; ***, P<0.001. D, E. Phosphorylation levels of ERK and Akt determined by Western blot analysis in maeg loss- and gain-of-function embryos. F. Confocal images of ISVs in control embryos, maeg mutants, itgb1a morphants, and itgb1a morphants coinjected with maeg mRNA using Tg(kdrl:EGFP) transgenic embryos. G. Percentage of embryos with ISV defect in each group. |
|
The phenotype of maeg and itgb1 loss-of-function involves Notch signaling. A. Whole mount in situ hybridization analysis of zebrafish embryos using antisense notch1a, notch1b, notch2, notch3, jag1a, jag1b, and jag2b probes. 30 hpf, lateral view. Blue arrowheads indicate the notochord position. Red arrowheads indicate the trunk vessel position. B. Confocal images of ISVs in control embryos, maeg morphants, maeg morphants treated with DAPT, and maeg morphants coinjected with dll4 MO using Tg(kdrl:EGFP) transgenic embryos. The red and white dash lines indicate the position of dorsal roof and horizontal myoseptum respectively. C. The statistics of ISV length in 30 hpf control embryos, maeg morphants, maeg morphants treated with DAPT, and maeg morphants coinjected with dll4 MO. One-Way ANOVA; ***,P<0.001. D. Confocal imaging analysis of endothelial numbers of ISVs in 30 hpf control embryos, maeg morphants, maeg morphants treated with DAPT, and maeg morphants coinjected with dll4 MO using Tg(fli1a:EGFP) transgenic embryos. Nuclei of ISVs are numbered. E. Quantification of ECs nuclei number in ISV. Measurements were made from three adjacent ISVs (over yolk) per embryo from 3 independent experiments. One-Way ANOVA; ***,P<0.001. F. Confocal images of ISVs in control embryos, itgb1a morphants, and itgb1a morphants coinjected with dll4 MO using Tg(kdrl:ras-mCherry::fli1a:nEGFP) transgenic line at 30 hpf. G. Quantification of ECs nuclei number in ISV. Measurements were made from three adjacent ISVs (over yolk) per embryo from 3 independent experiments. One-Way ANOVA; ***,P<0.001. H. The statistics of ISV length. One-Way ANOVA; ***,P<0.001. |
|
maeg loss of function results in the blood vessel morphogenesis defects in zebrafish embryos. A. Zebrafish embryos of WT, maeg?/? and maeg morphants at 24 hpf imaged in bright field. Square in dash line indicates the confocal imaging region of panel B. B. Confocal imaging analysis of trunk vascular morphology in WT, maeg?/? and maeg morphants Tg(kdrl:EGFP) embryos at 24 hpf. Red and white square brackets indicate the lumen of the DA and PCV, respectively. DA, dorsal aorta; PCV, posterior cardinal vein. C. Western blot analysis of Maeg expression in 24hpf control and mutants whole embryos. |
|
Maeg loss-of-function does not affect somite and hindbrain formation. A, B. Microscopy analysis of the somites of zebrafish embryos in brightield. C, D. Antibody immunostaining analysis showed the somite boundary in WT and maeg mutants. E, F. Confocal imaging analysis of hind brain development in WT and maeg mutants using Tg(huC:egfp) transgenic line. |
|
Maeg overexpression resulted in the formation of excessive branching. Confocal imaging analysis of ISVs morphology in control and maeg mRNA injected Tg(kdrl:EGFP) embryos at 48 hpf. Red arrows indicate aberrant structures. |
|
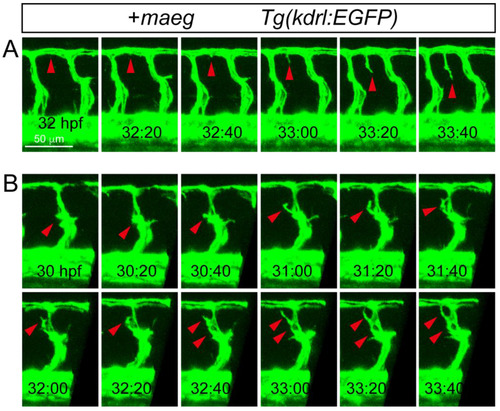
The Mmaeg gain-of-function embryos resulted in the ectopic branching angiogenic behaviors in the DLAV and ISV. A, B. Still images from in vivo time-lapse imaging analysis of the ectopic branching angiogenic behaviors in DLAV and ISV using Tg(kdrl:EGFP) embryos. Time (hpf) is noted in the bottom. Red arrowheads indicate the branching sprouts. |
|
Blocking the function of MEK with specific inhibitor U0126 or PD98059 treatment resulted in sprouting angiogenesis defects. A. Confocal images of ISVs morphology in 30 hpf Tg(kdrl:EGFP) transgenic embryos treated with DMSO, U0126 or PD98059. B. Confocal images of 30hpf Tg(fli1a:EGFP) transgenic embryos treated with DMSO, U0126 or PD98059. C. The statistics of ISV length in embryos treated with DMSO, U0126 or PD98059. One-Way ANOVA; ***,P<0.001. D. Quantification of ECs nuclei number in ISV. Measurements were made from three adjacent ISVs (over yolk) per embryo from 3 independent experiments. One-Way ANOVA; ***, P<0.001. |
|
Identification of itgb1 isoform highly enriched in zebrafish ECs. A. Diagram of the experimental procedure. B. Diagnostic FACS analysis of the sorted cells. P4 is the GFP positive cells; P5 is GFP negative cells. C. Quantitative PCR analysis of kdra and mflt1 gene expression between GFP positive cells and GFP negative cells after FACs sorting. D. RT-PCR analysis of expression of itgb1a, itgb1b, itgb1b.1 and itgb1b.2. E-H. Whole mount in situ analysis of itgb1a, itgb1b, itgb1b.1 and itgb1b.2 at 24 hpf. |
|
The phenotype of itgb1 loss-of-function involves Notch signaling. A. Whole mount in situ hybridization analysis of zebrafish embryos using antisense notch1a, notch2, notch3, jagged1a, jagged1b, jagged2 and deltaC probes. 30 hpf, lateral view. B. Confocal images of ISVs in control embryos, dll4 morphants, control embryos treated with DAPT, and itgb1 morphants treated with DAPT using Tg(kdrl:ras-mCherry::fli1a:nEGFP) transgenic line. |


