|
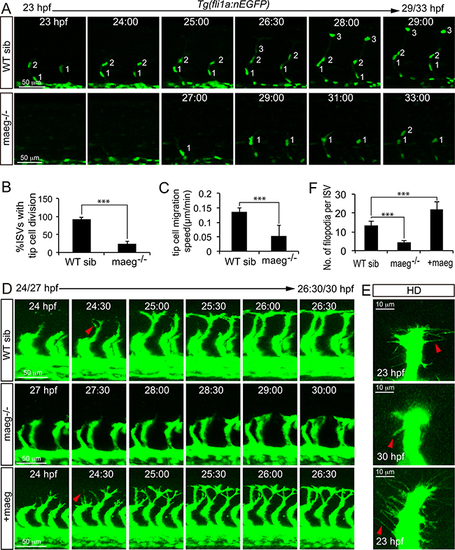
Maeg regulates ISV tip cell behaviors. A. Still images from in vivo time-lapse imaging analysis of WT and maeg?/?Tg(fli1a:nEGFP) embryos. Time (hpf) is noted in the top. Nuclei of ISVs are numbered. B. Percentage of ISVs with tip cell division in control embryos and maeg?/? embryos. Student?s t-test; ***,P<0.001. C. Migration speed of ISV tip cells. Mann Whitney U-test; ***,P<0.001. D. Still images from in vivo time-lapse imaging analysis of ISV tip cell filopodia in Tg(kdrl:EGFP) embryos. Time (hpf) is noted in the bottom. Red arrowheads indicate filopodia extensions. E. Confocal imaging analysis of ISV tip cell filopodia in Tg(kdrl:EGFP) embryos with HD detection setting. Red arrowheads indicate filopodia extensions. F. ISV tip cell filopodia number in per ISVs. One-Way ANOVA; ***, P<0.001.
|