- Title
-
Overexpression of PDGFRA cooperates with loss of NF1 and p53 to accelerate the molecular pathogenesis of malignant peripheral nerve sheath tumors
- Authors
- Ki, D.H., He, S., Rodig, S., Look, A.T.
- Source
- Full text @ Oncogene
|
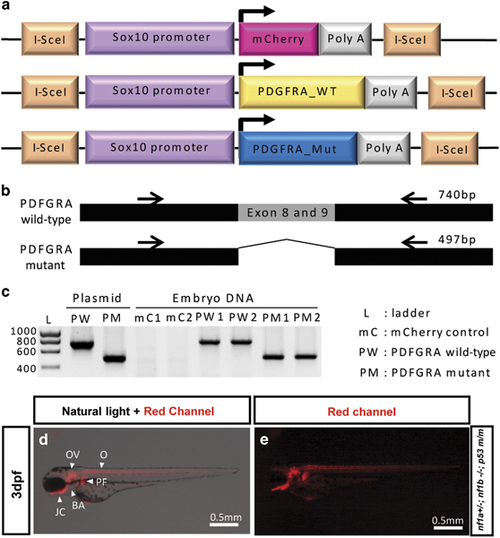
I-SceI meganuclease-mediated human PDGFRA transgenesis in nf1- and p53-deficient fish. (a) Schematic diagram of the DNA constructs used to generate transgenic sox10:mCherry, sox10:wild-type (WT) and constitutively activated (Mut) PDGFRAs zebrafish. I-SceI denotes the I-SceI meganuclease target sequence. (b) Schematic diagram of PCR target of human wild type and constitutively activated mutant PDGFRA (? exons 8 and 9) for genotyping. Black arrows represent primer target sites for PCR. (c) PDGFRA wild-type and mutant DNA sequences were detected in genomic DNA of the transgenic zebrafish embryos. Human PDGFRA sequences were confirmed with embryonic DNA of two separate transgenic lines (mC1 and mC2, PW1 and PW2 and PM1 and PM2). Each amplified PCR band of PDGFRA wild type and mutant had sizes of 740 and 497?bp, respectively. Injected plasmids for transgenesis were used as the positive control. (d and e) Sox10 promoter driving mCherry is expressed in cells of neural crest origin during early embryogenesis. Tg (nf1a+/?; nf1b?/?; p53m/m; sox10:mCherry) zebrafish embryo at 3?d.p.f. showed mCherry expression throughout otic vesicle (OV), branchial arches (BA), oligodendrocytes (O), jaw cartilage (JC) and pectoral fins (PF). EXPRESSION / LABELING:
|
|
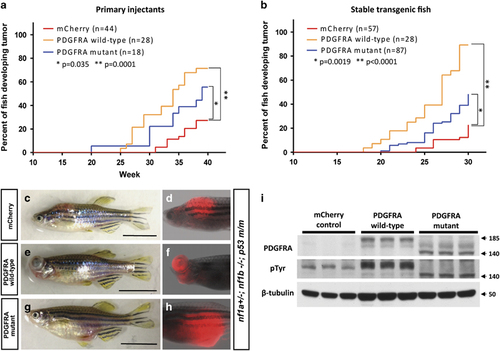
Both wild-type and constitutively activated mutant forms of PDGFRA accelerate MPNST tumorigenicity in nf1- and p53-deficient fish. (a and b) Kaplan?Meier analysis of tumorigenesis in fish with either mosaic or stable expression of the PDGFRA transgene. Onset of MPNSTs in nf1- and p53-deficient zebrafish (nf1a+/?; nf1b?/?; p53m/m) injected with the following DNA constructs: (1) sox10:mCherry alone (mCherry, red); (2) sox10:PDGFRA wild-type and sox10:mCherry (PDGFRA wild-type, yellow); or (3) sox10:PDGFRA mutant and sox10:mCherry (PDGFRA mutant, blue). Note that wild-type PDGFRA overexpression accelerated the onset of MPNSTs more rapidly than constitutively activated mutant PDGFRA. (c?h) Representative images of the sox10 promoter driving mCherry-positive tumors under different conditions. Transgenic sox10:mCherry (c and d), sox10:mcherry/PDGFRA wild-type (e and f) and sox10:mCherry/PDGFRA CA mutant (g and h) in the nf1a+/?; nf1b?/?; p53m/m background induced tumors that strongly expressed mCherry protein (>30?w.p.f., scale bar=10?mm). (i) Western blot analysis for PDGFRA in protein lysates prepared from tumors of mCherry control, PDGFRA wild-type and PDGFRA mutant fish. PDGFRA wild-type, mutant and their phosphorylated (active) forms were detected. ?-Tubulin was used an internal control for equal loading. Arrow denotes protein size (kDa). PHENOTYPE:
|
|
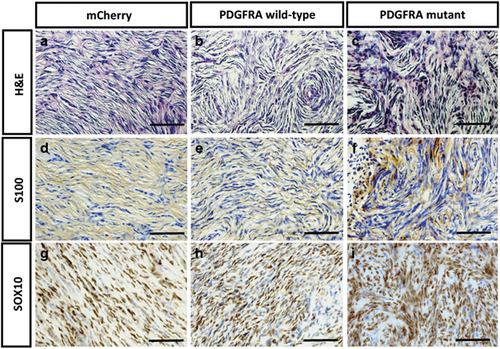
PDGFRA-induced zebrafish MPNST tumors exhibit similar histology to that of human MPNSTs. (a?c) The histopathology after H&E staining of the zebrafish MPNSTs was identical in the nf1a+/?; nf1b?/?; p53m/m zebrafish when either PDGFRA wild-type or mutant proteins were overexpressed. In each genotype, the zebrafish MPNST histopathology was very similar to that of human MPNSTs. The zebrafish MPNSTs comprise spindle cells that stack into short fascicles, typically with a whirling organization pattern. MPNST cells have long serpentine-like nuclei and are spindle-shaped. (d?i) Markers of cells of neural crest origin were expressed by the zebrafish MPNST tumors, such as S100 (d?f) and Sox10 (g?i). S100 was detected in the cell membrane and nucleus, whereas Sox10 was detected in the nucleus. Scale bar=200??m. |
|
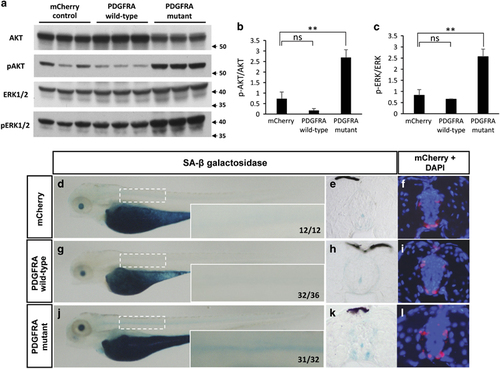
Overexpression of the PDGFRA wild-type gene activates AKT and ERK at levels optimal for tumorigenicity. (a) Western blot analysis for AKT and ERK1/2 activation in protein lysates prepared from tumors of mCherry control, PDGFRA wild-type, and PDGFRA mutant fish. Similar levels of p-AKT and p-ERK1/2 were detected in PDGFRA wild-type tumors as compared with mCherry control tumors; however, tumors induced by the PDGFRA mutant showed increased levels of p-AKT and p-ERK1/2. Proteins were detected by stripping the membrane and reprobing. Arrows denote protein size (kDa). (b and c) Statistical analysis of meanąs.d. of p-AKT/total AKT and p-ERK/total AKT using ImageJ. Asterisks indicate statistical significance (**P<0.005). (d, g and j) Representative images of SA-? galactosidase-stained transgenic fish embryos of mCherry control (n=12), PDGFRA wild-type (n=36) and PDGFRA mutant (n=32) in the nf1a+/?; nf1b?/?; p53m/m background at 4?d.p.f. The boxed areas were magnified at the right bottom corner of each panel. (e, h and k) Transverse cryosections through the spinal cord of embryos at 4?d.p.f., with mCherry and DAPI (4',6-diamidino-2-phenylindole; f, i and l). |
|
Sunitinib retards the progression of primary MPNSTs in transgenic fish with wild-type PDGFRA. (a?f) Images of Tg (sox10:PDGFRA wild-type; sox10:mCherry; nf1a+/?; nf1b?/?; p53m/m) zebrafish with primary MPNSTs before drug treatment. mCherry driven by the sox10 promoter is expressed by the tumor cells. Fish with MPNSTs were incubated in 2??m of sunitinib (n=3) or DMSO (n=3) in the fish water for 10 days. (g?l) After drug treatment, tumor images were taken under the same condition as before treatment. (m) Comparison of cross-sectional areas of MPNSTs after sunitinib treatment and the DMSO control shows that the tumors increase in size when treated with the DMSO vehicle, and that this growth appears to be retarded by sunitinib treatment (P<0.05). PHENOTYPE:
|
|
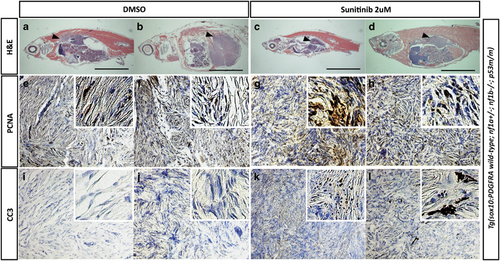
Sunitinib promotes apoptosis of primary MPNST progression in transgenic fish expressing wild-type PDGFRA. (a?d) Histopathology after H&E staining of the DMSO- (a and b) or sunitinib- (c and d) treated MPNSTs. Black arrowheads show areas of MPNSTs (black scale bar=5?mm). Proliferating cell nuclear antigen (e?h) and cleaved caspase-3 (i?l) stains of each condition for proliferation and apoptosis analysis, respectively. The right upper corner of each panel shows magnified stained areas. PHENOTYPE:
|
|
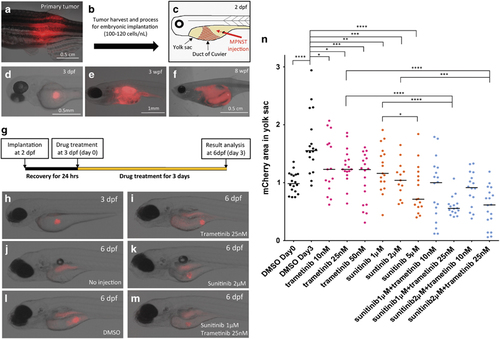
Sunitinib activity is enhanced when given in combination with the MEK inhibitor trametinib in an assay using implanted zebrafish MPNST cells. (a?f) Photomicrographs of mCherry expressing transplanted MPNST cells. (a) Primary zebrafish MPNSTs were harvested from wild-type PDGFRA transgenic fish, and (b) ~100?120 tumor cells were implanted into the yolk sac of a 2?d.p.f. embryo. (c) Illustration of our implantation. Red arrow represents direction of the microneedle for cell injection. (d) Representative image of implanted MPNST embryo at 3?d.p.f. (e) Injected MPNST cells were expanded and (f) formed tumor mass in embryos. (g) Schematic diagram of our implantation and drug treatment assay. MPNST cells were transplanted into 2?d.p.f. embryos and treated with drugs in the fish water from 3 to 6?d.p.f. (h?m) Representative fish images at 6?d.p.f. after drug treatment. Because autofluorescence was expressed from the embryo gut (j), mCherry expressed areas in yolk sac were only analyzed for this assay. (n) MPNST tumor cell growth in the yolk sac of the implanted embryos. These embryos were treated with vehicle control, trametinib, sunitinib or combinations of trametinib and sunitinib (n=20 per condition). The asterisks indicate the range of the different P-values of Student's t-test (*P<0.05; **P<0.01; ***P<0.001; ****P<0.0001). Black bar in each column scatter plot represents the median value. PHENOTYPE:
|
|
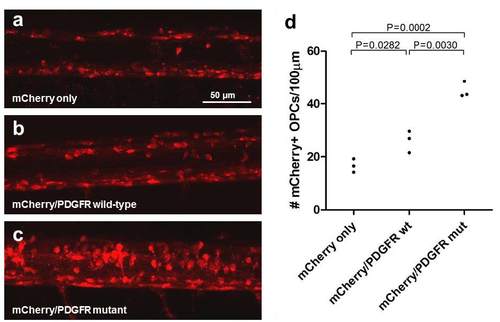
PDGFRA overexpression causes hyperplasia of OPCs and Schwann cells (a-c) Representative confocal images of the spinal cords of mCherry control (n=3), wild-type PDGFRA (n=3), and mutant PDGFRA (n=3) transgenic 6 dpf larvae in the nf1a+/+; nf1b-/-; p53m/m background. Both (b) wild-type PDGFRA and (c) mutant PDGFRA transgenic larvae demonstrate increased numbers of sox10:mCherry-positive oligodendrocyte progenitor cells (OPCs) as compared to (a) mCherry control larvae in the nf1a+/+;nf1b-/- ; p53 m/m background. (d) Quantification of the sox10:mCherry-positive OPC number within a 100 ?m region of the thoracic spinal cord. |
|
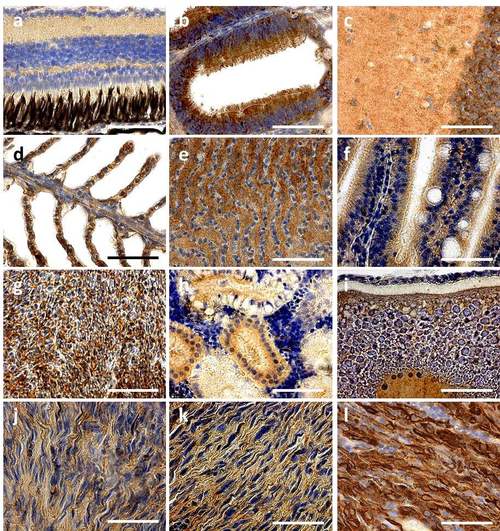
PDGFRA expressed tissues in adult fish (a-i) Representative images of PDGFRA expression by immunohistochemistry in sox10:mCherry control transgenic zebrafish in the nf1a+/-;nf1b-/- ; p53 m/m background (>30 weeks post fertilization). PDGFRA is expressed in (a) the eye inner and outer plexiform layers, (b) olfactory ciliated columnar epithelium, (c) brain, (d) gill, (e) the gill pseudobranch, (f) intestine, (g) liver, (h) kidney, and (i) vitellogenic oocytes. (j-l) Representative images of PDGFRA expression by sox10:mCherry control (j), PDGFRA wild-type (k) and mutant MPNSTs (l) in the the nf1a+/-;nf1b-/- ; p53 m/m background, respectively (>30 weeks post fertilization, scale bar = 10 ?m). |
|
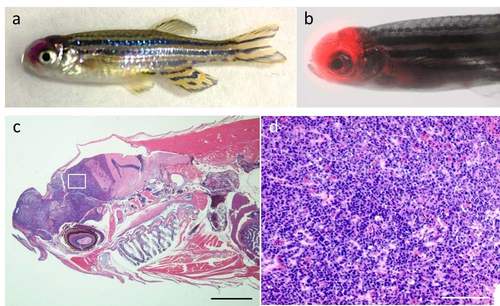
Images of the sox10 promoter driving mCherry-positive brain tumors (a) A transgenic sox10:mCherry/PDGFRA transgenic fish haboring a brain tumor in the nf1a+/-;nf1b-/- ; p53 m/m background (>30 weeks post fertilization). (b) mCherry protein is strongly expressed in the glioma cells. (c-d) The histopathology after hematoxylin and eosin (H&E) staining of the zebrafish brain tumor. Panel d shows the glial tumor cells magnified from the white square area of panel c. (black scale bar = 1 mm, white scale bar = 0.1 mm). |
|
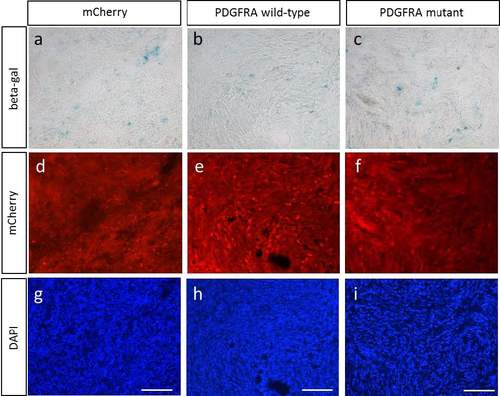
Representative images of SA-? galactosidase stained-transgenic zebrafish MPNSTs (a-c) Images of SA-? galactosidase stained-transgenic fish MPNSTs of (a) mCherry control, (b) PDGFRA wild type, and (c) PDGFRA mutant in the nf1a+/-;nf1b-/- ; p53 m/m background (>30 weeks post fertilization), with (d-f) mCherry and (g-i) DAPI (scale bar=100?m). |
|
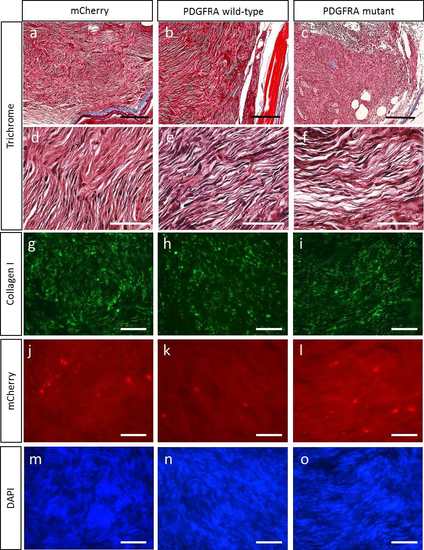
Fibrosis of the transgenic zebrafish MPNSTs is not changed by either wild-type or mutant PDGFRA (a-c) Representative images of the trichrome stained transgenic fish MPNSTs of (a) mCherry control, (b) PDGFRA wild type, and (c) PDGFRA mutant in the nf1a+/-;nf1b-/- ; p53 m/m background (>30 weeks post fertilization). Panels d, e, and f show the MPNST tumor cells magnified from panels a, b, and c, respectively.(g-i) Representative images of collagen I expression in transgenic fish MPNSTs of mCherry control with (g-i) mCherry and (j-l) DAPI (black scale bar=200 ?m, white scale bar=10 ?m). |
|
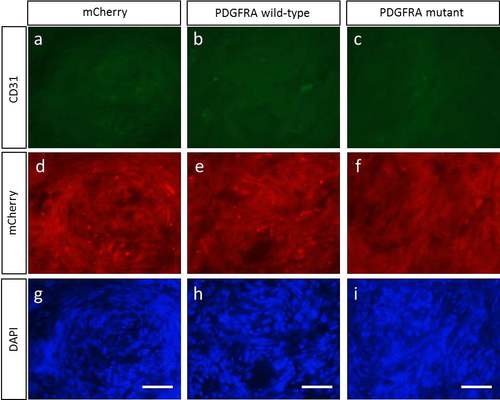
Vascularity of the induced MPNSTs is not altered by either wild-type or mutant PDGFRA (a-c) Representative images of CD31 expression in transgenic fish MPNSTs of (a) mCherry control, (b) PDGFRA wild type, and (c) PDGFRA mutant in the nf1a+/-;nf1b-/- ; p53 m/m background (>30 weeks post fertilization), with (d-f) mCherry and (g-i) DAPI (scale bar=10 ?m). |

