- Title
-
Ontogenetic development of the auditory sensory organ in zebrafish (Danio rerio): changes in hearing sensitivity and related morphology
- Authors
- Wang, J., Song, Q., Yu, D., Yang, G., Xia, L., Su, K., Shi, H., Wang, J., Yin, S.
- Source
- Full text @ Sci. Rep.
|
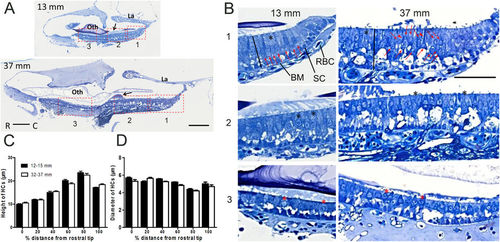
Comparison of HC morphology in semi-thin sections of the saccular epithelia of zebrafish with a TL of 13?mm or 37?mm. (A) Representative images of semi-thin sections. Scale bars: 100??m; La: lagena; oth: otolith; black arrow: otolithic membrane. (B) Magnified images of different regions specified by the rectangles in A. In the 13?mm fish, the HCs were oriented in a monolayer across the entire saccule, whereas the HCs in the 37?mm fish were crowded, especially in the caudal region: the red arrows indicate HC nuclei located different distances from the surface (B, right upper panel), and the red arrowheads indicate HCs containing deeper nuclei that display cell bodies that are pushed above the nuclei. Scale bars: 50??m; SC: supporting cells; BM: basement membrane; RBC: red blood cell; black line: the distance from the cuticular plate to the basement membrane; black asterisk: cylindrical HCs; red asterisk: pear-shaped HCs. (C,D) Differences in the location of HCs according to HC height and diameter in two TL groups. The HC height and diameter were measured at 6 locations across the saccule, from the rostral end (0% in distance) to the caudal end (100% in distance). At a point 80% of the distance from the rostral end (region 9 in Fig. 3C), the cell bodies of the HCs were the longest and had the smallest diameter. Two-way ANOVAs showed no significant TL effect for HC height (P?=?0.58, n?=?10 for each group) or diameter (P?=?0.99, n?=?10 for each group) but showed a significant effect of location for both HC height and diameter (P?<?0.0001). |
|
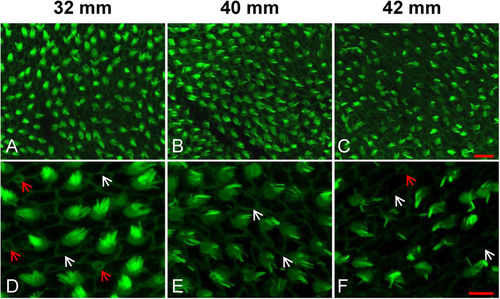
Representative images showing the degeneration of HC bundles with age. (A?C) Low magnification images of HC bundles in the anterior saccule of 32, 40 and 42?mm TL fish (6, 18 and 20 months, respectively). (D?F) High magnification images of (A?C). White arrows: cell-cell borders; red arrows: immature HCs; scale bars: 10??m (A?C) or 5??m (D-F). |
|
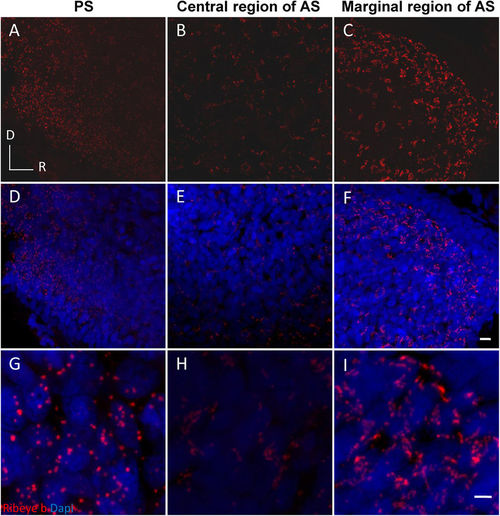
Representative images showing regional differences in Ribeye b expression in a 35?mm fish. A dispersed distribution of round puncta (red) were observed in the posterior saccule (A,D,G). Clustered spots of labelling were observed in the marginal anterior saccule (C,F,I). Smaller but still clustered puncta were observed in the central region of the anterior saccule (B,E,H). (G?I) are magnified from (D?F), respectively. AS: anterior saccule; PS: posterior saccule; R and D: rostral and dorsal, respectively; scale bars: 5??m (A?F) or 2??m (G?I). |
|
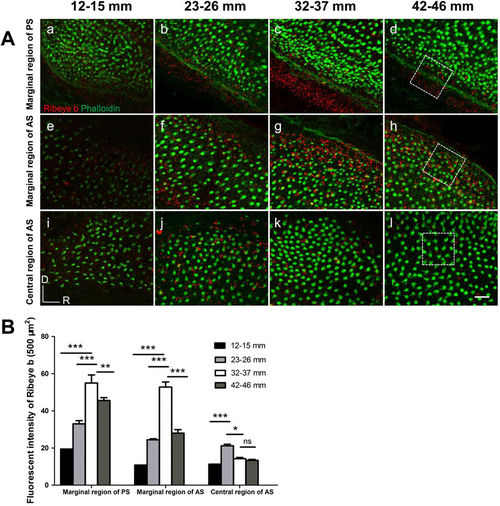
Representative images of Ribeye b staining in distinct regions of different TL groups. (A) The ventral marginal region of the posterior saccule (a?d), the dorsal marginal region of the anterior saccule (e?h), and the central region of the anterior saccule (i?l), corresponding to regions 8, 1 and 3, respectively, as labelled in Fig. 3C. White dotted rectangles: the areas used for fluorescence intensity analysis, which is presented in B. (B) TL (age)-related changes in the fluorescence intensity of Ribeye b protein immunolabelling in three regions. An increase in the fluorescence intensity of Ribeye b immunolabelling was visible in the two marginal regions (regions 1 and 8) from the 12?15?mm TL group to the 32?37?mm TL group (a?c and e?g), followed by a decrease in the 42?46?mm TL group that was accompanied by a decrease in HC density (d,h). In the central region (region 3), a decrease in fluorescence intensity was observed in the 32?37?mm TL group (k compared to j). The asterisks indicate the significance of the differences within each region across different TL groups based on ANOVA followed by post hoc tests. *P?<?0.05, **P?<?0.01, ***P?<?0.001. |
|
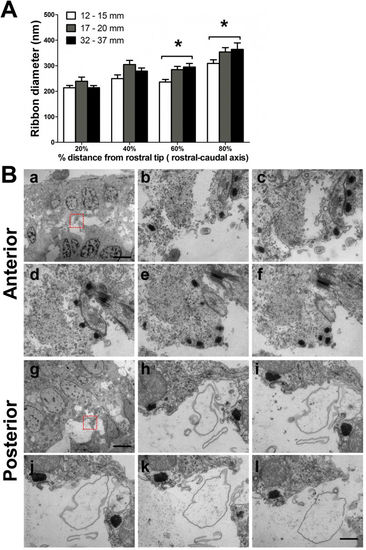
Ribbon diameter across different TLs and regions. (A) Comparison across three TL groups at four distances from the rostral end (0%, 20%, 60% and 80% distances) of the sensory epithelium (ribbon number observed at the four distances: n?=?52, 36, 33 and 22, respectively, for 12?15?mm TL fish; n?=?22, 24, 39 and 30, respectively, for 17?20?mm TL fish; and n?=?52, 30, 37 and 16, respectively, for 32?37?mm TL fish). *P?<?0.05, post hoc tests within each distance between the indicated TL groups. (B) Representative TEM images of serial sections. The HCs of the anterior saccule contained small ribbons that were close to each other (a?f), in contrast to the large, rounded and dispersed ribbons observed in HCs in the posterior saccule (g?l). The red rectangles in (a,g) indicate the regions that were magnified and observed in the serial sections (b?f and h?l, respectively). Scale bars: 5??m (a and g); 500?nm in all magnified images. |
|
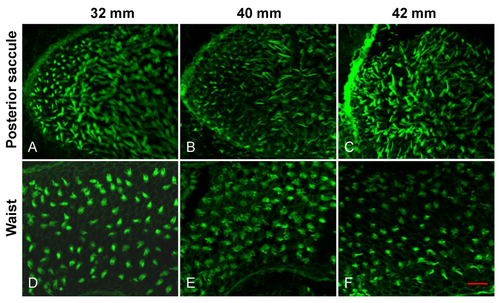
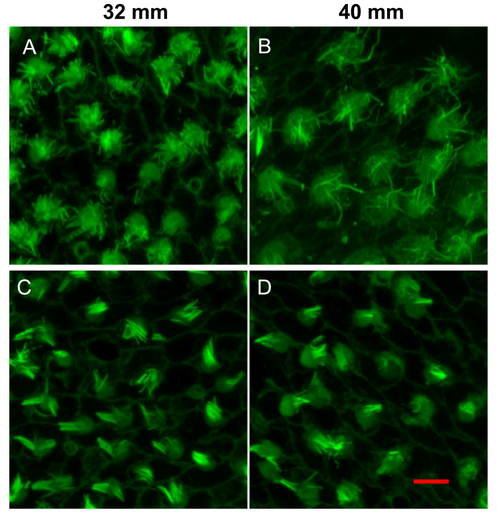
Images of HC bundles in the saccule waist and the posterior saccule (supplemental to Fig. 5). Scale bars: 10 ?m (A-F). |
|
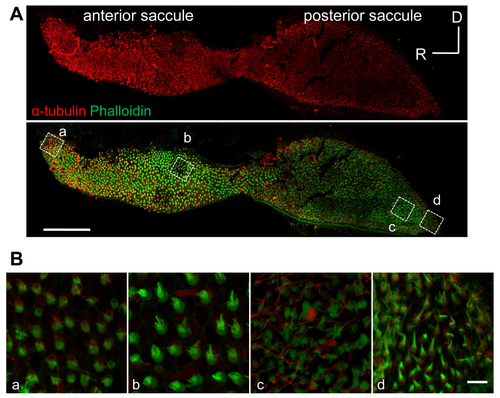
Images of saccular HC bundles. (A) Representative images of kinocilia, which were immunostained for ?-tubulin (red), and stereocilia, which were counterstained with phalloidin (green). Scale bars: 100 ?m. Fish TL = 41 mm. (B) Magnified images from regions inside the dotted rectangles in the lower panel of (A). Scale bars: 5 ?m (a-d). |
|
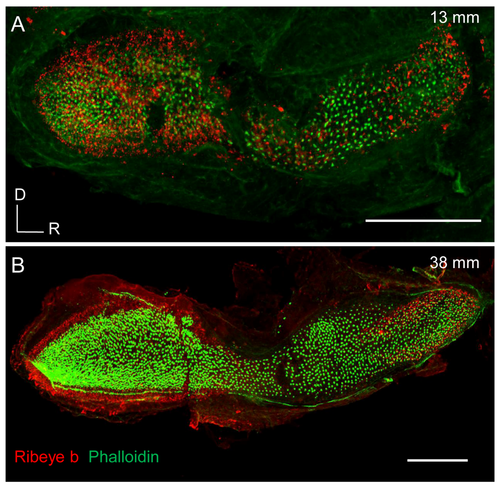
Immunofluorescence labelling for Ribeye b. Representative images of saccules from young (A) and old zebrafish (B) showing Ribeye b expression (red) and hair bundles stained with phalloidin (green). Scale bars: 100 ?m. |
|
Fixation does not impact the quantity of HC bundles. Two independent experiments of HC bundle staining (A-B and C-D, respectively) were repeated to examine the impact of fixation on the quantity of HC bundles observed in the 32-37 mm and 39-40 mm TL fish groups (n = 4 in each group). Scale bars: 5 ?m (A-D). |

