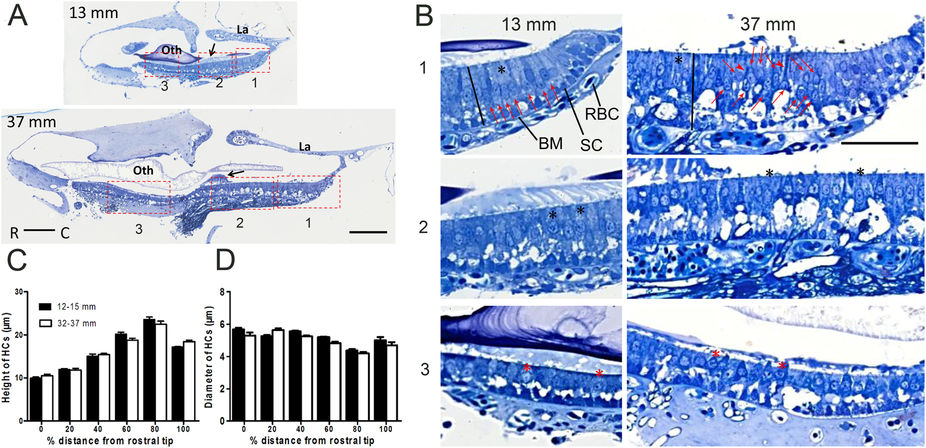
Fig. 4
Comparison of HC morphology in semi-thin sections of the saccular epithelia of zebrafish with a TL of 13?mm or 37?mm.
(A) Representative images of semi-thin sections. Scale bars: 100??m; La: lagena; oth: otolith; black arrow: otolithic membrane. (B) Magnified images of different regions specified by the rectangles in A. In the 13?mm fish, the HCs were oriented in a monolayer across the entire saccule, whereas the HCs in the 37?mm fish were crowded, especially in the caudal region: the red arrows indicate HC nuclei located different distances from the surface (B, right upper panel), and the red arrowheads indicate HCs containing deeper nuclei that display cell bodies that are pushed above the nuclei. Scale bars: 50??m; SC: supporting cells; BM: basement membrane; RBC: red blood cell; black line: the distance from the cuticular plate to the basement membrane; black asterisk: cylindrical HCs; red asterisk: pear-shaped HCs. (C,D) Differences in the location of HCs according to HC height and diameter in two TL groups. The HC height and diameter were measured at 6 locations across the saccule, from the rostral end (0% in distance) to the caudal end (100% in distance). At a point 80% of the distance from the rostral end (region 9 in Fig. 3C), the cell bodies of the HCs were the longest and had the smallest diameter. Two-way ANOVAs showed no significant TL effect for HC height (P?=?0.58, n?=?10 for each group) or diameter (P?=?0.99, n?=?10 for each group) but showed a significant effect of location for both HC height and diameter (P?<?0.0001).

