Fig. 7
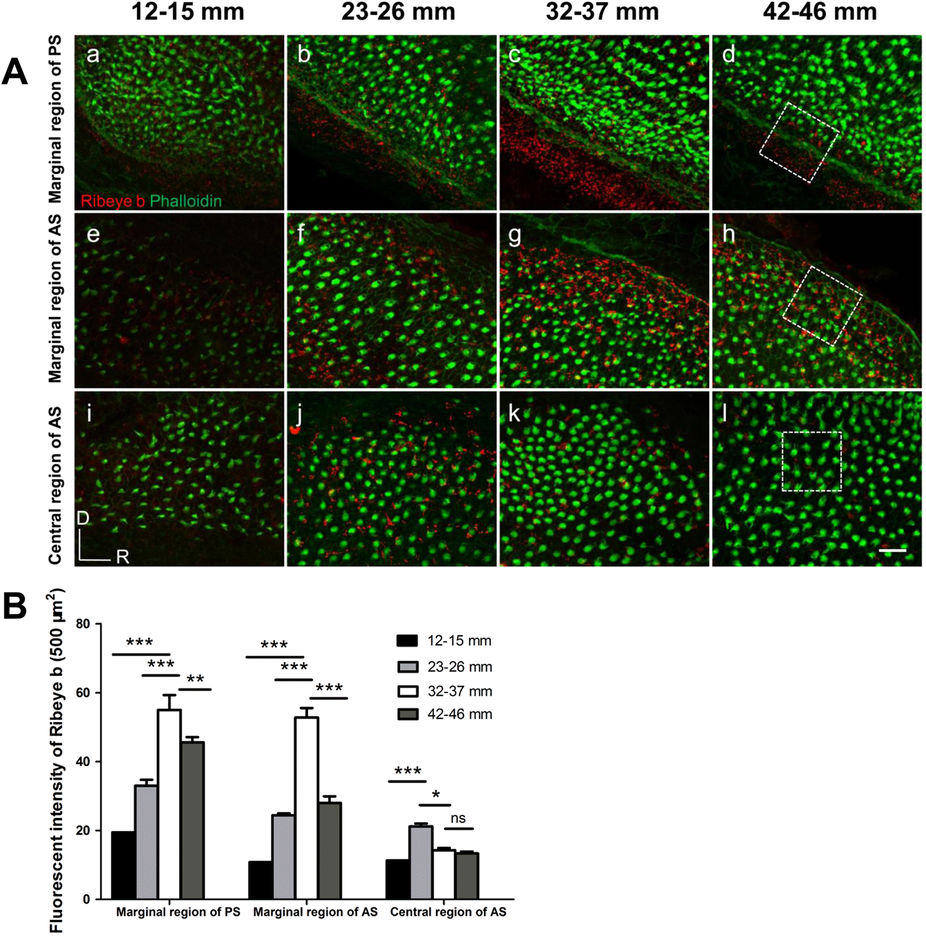
Representative images of Ribeye b staining in distinct regions of different TL groups.
(A) The ventral marginal region of the posterior saccule (a?d), the dorsal marginal region of the anterior saccule (e?h), and the central region of the anterior saccule (i?l), corresponding to regions 8, 1 and 3, respectively, as labelled in Fig. 3C. White dotted rectangles: the areas used for fluorescence intensity analysis, which is presented in B. (B) TL (age)-related changes in the fluorescence intensity of Ribeye b protein immunolabelling in three regions. An increase in the fluorescence intensity of Ribeye b immunolabelling was visible in the two marginal regions (regions 1 and 8) from the 12?15?mm TL group to the 32?37?mm TL group (a?c and e?g), followed by a decrease in the 42?46?mm TL group that was accompanied by a decrease in HC density (d,h). In the central region (region 3), a decrease in fluorescence intensity was observed in the 32?37?mm TL group (k compared to j). The asterisks indicate the significance of the differences within each region across different TL groups based on ANOVA followed by post hoc tests. *P?<?0.05, **P?<?0.01, ***P?<?0.001.

