
- Title
-
Matrix metalloproteinases as promising regulators of axonal regrowth in the injured adult zebrafish retinotectal system
- Authors
- Lemmens, K., Bollaerts, I., Bhumika, S., De Groef, L., Van Houcke, J., Darras, V.M., Van Hove, I., Moons, L.
- Source
- Full text @ J. Comp. Neurol.
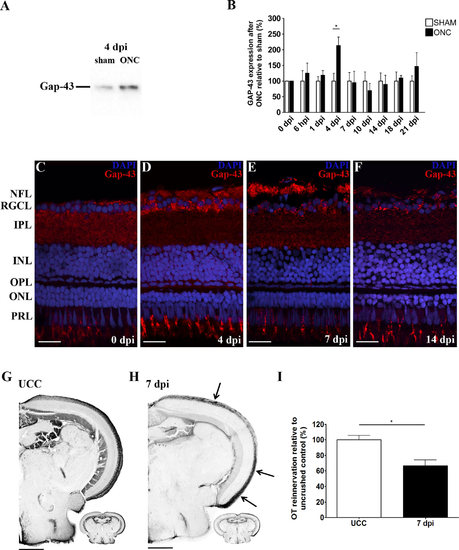
Mapping of RGC axonal regrowth after ONC in adult zebrafish. A,B: Western blotting (WB) for Gap-43 (20-25 kDa) on retinal extracts harvested at different timepoints after optic nerve crush (ONC) reveals a peak in Gap-43 expression at 4 days postinjury (dpi). For the quantitative analysis, values from ONC samples were plotted relative to sham-operated values, which were put at 100%. Data were collected from at least three retinal samples per timepoint and are shown as mean � SEM (*P < 0.05). C-F: Immunostainings for Gap-43 on retinal sections at various stages postinjury show Gap-43 upregulation in retinal ganglion cell (RGC) somata at 4 dpi and increasing Gap-43 signal in RGC axons from 4-7 dpi. Gap-43 expression reapproaches control levels at 14 dpi. DAPI (blue) was used as nuclear counterstain. G,H: Microscopic images of biocytin-labeled brain sections of uncrushed control fish (UCC) and 7 dpi fish visualizing innervation of the contralateral optic tectum (OT) by RGC axons. Regenerating RGC axons entering the OT at 1 week postinjury are indicated by arrows. I: Quantification of the area covered by RGC axons in the OT at 7 dpi, relative to UCC, confirms that axonal regeneration is fully ongoing. Data represent mean � SEM (n = 5 animals per group, *P < 0.05). ONC, optic nerve crush; dpi, days postinjury; UCC, uncrushed control; NFL, nerve fiber layer; RGCL, retinal ganglion cell layer; IPL, inner plexiform layer; INL, inner nuclear layer; OPL, outer plexiform layer; ONL, outer nuclear layer; PRL, photoreceptor layer. Scale bars = 20 �m in C-F; 200 �m in G,H. |
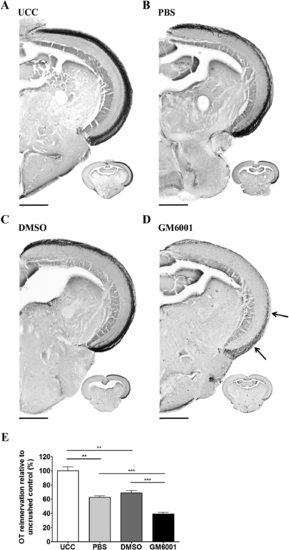
Retinal broad-spectrum MMP inhibition after ONC reduces OT reinnervation. A-D: Representative images depicting reinnervation of the OT by RGC axons at 7 dpi after PBS, DMSO, or GM6001 treatment, reveal a clearly diminished reinnervated OT area after broad-spectrum matrix metalloproteinase (MMP) inhibition (see arrows) as opposed to vehicle control and UCC fish. E: Quantification of the area covered by RGC axons in the OT of the various treatment conditions, relative to UCC fish. Both DMSO- and PBS-treated fish show 60% reinnervation of the OT relative to the completely innervated OT in the UCC condition. A significant reduction in tectal reinnervation was noted in GM6001-treated fish compared to the vehicle controls. Data represent mean � SEM and 8-15 animals were used per condition over three independent experiments (*P < 0.05; **P < 0.005; ***P < 0.001). UCC, uncrushed control; PBS, phosphate-buffered saline; DMSO, dimethyl sulfoxide. Scale bars = 200 �m. |
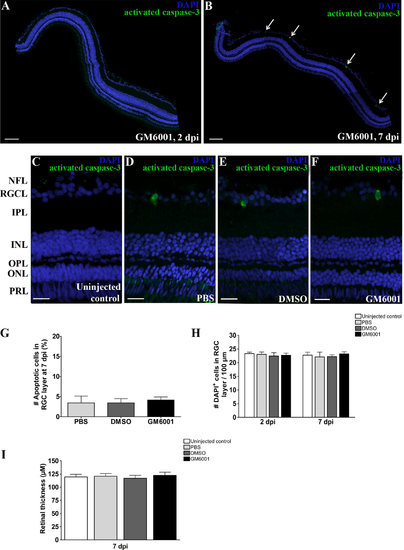
Lowering general MMP activity after ONC does not influence RGC survival, nor reduces retinal thickness. A,B: Representative confocal images of retinal sections immunostained for activated caspase-3 reveal no apoptotic cells in GM6001-treated eyes at 2 dpi (A) and only a limited number of apoptotic cells in the RGCL at 7 dpi (see arrows) (B). C-F: Magnifications of an activated caspase-3 immunostaining on retinal sections of PBS-, DMSO-, and GM6001-treated fish indicate a similar amount of apoptotic RGCs at 7 dpi in the three conditions, while apoptosis is absent in UCC fish. Moreover, no obvious disruption of retinal structure, nor retinal thinning can be observed in GM6001-injected fish. DAPI (blue) was used as nuclear counterstain. G: Quantitative analysis of the ratio of activated caspase-3+ cells/DAPI+ cells in the RGCL reveals no difference between PBS-, DMSO-, and GM6001-treated fish at 7 dpi. Data represent five fish per group and are shown as mean � SEM. H: Likewise, the number of DAPI+ cells per 100 �m of RGCL was similar in all conditions, both at 2 and 7 dpi, confirming that no significant cell loss is induced after ONC/treatment. Data represent five fish per group and are shown as mean � SEM. I: A quantitative analysis on retinal sections did not reveal any significant differences in retinal thickness of uninjected, PBS-, DMSO-, and GM6001-treated fish at 7 dpi. Six retinal sections were analyzed per fish, using five fish per condition. Data are shown as mean � SEM. Dpi, days postinjury; PBS, phosphate-buffered saline; DMSO, dimethyl sulfoxide; NFL, nerve fiber layer; RGCL, retinal ganglion cell layer; IPL, inner plexiform layer; INL, inner nuclear layer; OPL, outer plexiform layer; ONL, outer nuclear layer; PRL, photoreceptor layer. Scale bars = 50 �m in A,B; 20 �m in C-F. |

Retinal spatiotemporal expression pattern of Mmp-13a protein after ONC in adult zebrafish. A,B: Representative picture and bar graph revealing western blotting analysis data for Mmp-13a on retinal extracts after ONC, showing significantly increased active Mmp-13a (45 kDa) levels at 7 dpi, represented as a relative percentage to sham-operated values. No differences in pro Mmp-13a (80 kDa) were observed. Data were collected from at least three retinal samples per timepoint and are shown as mean � SEM (**P < 0.005). C-E: Immunohistochemical stainings for Mmp-13a on retinal sections of sham-operated fish and fish with ONC, show an elevated Mmp-13a signal in the RGCL at 7 dpi, during axonal regrowth. DAPI (blue) was used as nuclear counterstain. F-H: High-magnification photographs of the RGCs after H&E, DAB, or immunofluorescent staining for Mmp-13a, altogether indicating expression of Mmp-13a in RGC somata and primary dendrites after ONC. DAPI (blue) or hematoxylin was used as nuclear counterstain. ONC, optic nerve crush; dpi, days postinjury; NFL, nerve fiber layer; RGCL, retinal ganglion cell layer; IPL, inner plexiform layer; INL, inner nuclear layer; OPL, outer plexiform layer; ONL, outer nuclear layer; PRL, photoreceptor layer. Scale bars = 20 �m. |
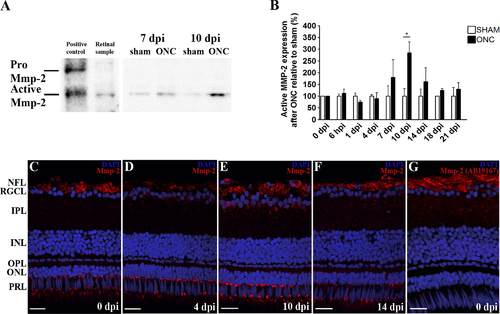
Figure 5. Retinal spatiotemporal expression pattern of Mmp-2 protein after ONC in adult zebrafish. A: Representative picture showing the presence of active Mmp-2 in adult zebrafish retinal extracts, as confirmed by labeling of both pro (72 kDa) and active (64 kDa) Mmp-2 in zebrafish embryo lysates (left). A,B: Western blotting for Mmp-2 on retinal extracts at different timepoints postinjury indicates a peak in active Mmp-2 expression at 10 dpi during retinotectal regeneration, as compared to sham-operated controls (put at 100%). Data represent at least three retinal samples per timepoint and are shown as mean � SEM (*P < 0.05). C-F: Immunostainings for Mmp-2 on retinal sections at 4 dpi disclose a decreased expression of Mmp-2 in RGC axons compared to controls, but an increased presence in RGC somata. During axonal regrowth, Mmp-2 expression becomes upregulated in RGC somata and axons, whereafter its expression again confines to RGC axons. G: An additional immunostaining on zebrafish retinal sections at 0 dpi, using a different MMP-2 antibody (EMD Millipore, AB19167), confirms Mmp-2 expression in the nerve fiber layer (NFL). For all immunostainings, DAPI (blue) was used as a nuclear counterstain. ONC, optic nerve crush; dpi, days postinjury; NFL, nerve fiber layer; RGCL, retinal ganglion cell layer; IPL, inner plexiform layer; INL, inner nuclear layer; OPL, outer plexiform layer; ONL, outer nuclear layer; PRL, photoreceptor layer. Scale bars = 20 �m. |
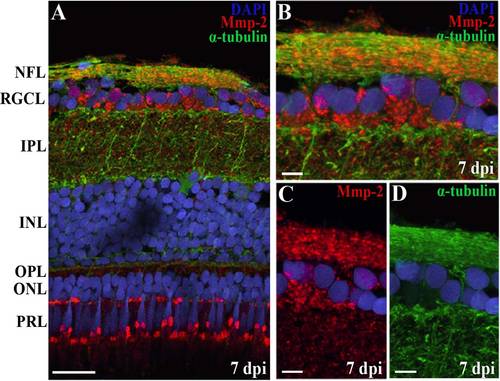
Overlap of α-tubulin and Mmp-2 expression on retinal sections localizes Mmp-2 in/on axons of the NFL. A-D: A double immunostaining for α-tubulin and Mmp-2 on retinal sections shows a similar expression of both proteins in the NFL and thus indicates expression of Mmp-2 in/on RGC axons. B-D: High-magnification pictures of double (B) and single (C,D) stainings. DAPI (blue) was used as a nuclear counterstain. ONC, optic nerve crush; dpi, days postinjury; NFL, nerve fiber layer; RGCL, retinal ganglion cell layer; IPL, inner plexiform layer; INL, inner nuclear layer; OPL, outer plexiform layer; ONL, outer nuclear layer; PRL, photoreceptor layer. Scale bars = 20 �m in A; 5 �m in B-D. |
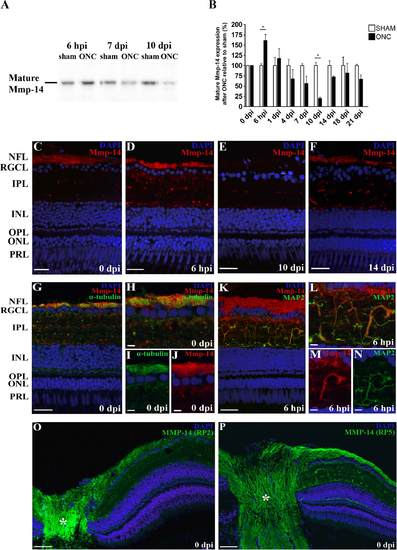
Retinal spatiotemporal expression pattern of Mmp-14 protein after ONC in adult zebrafish. A,B: Representative picture and bar graph revealing western blotting analysis data for Mmp-14 on retinal extracts after ONC, respectively showing significantly increased mature Mmp-14 (55-60 kDa) levels at 6 hpi and decreased levels at 10 dpi. Values from ONC samples were plotted relative to sham-operated values, which were put at 100%. Data represent at least three retinal samples per timepoint and are shown as mean � SEM (*P < 0.05). C-F: Immunostainings for Mmp-14 on retinal sections harvested at varying days after ONC equally show an upregulation of Mmp-14 in the nerve fiber layer (NFL) and inner plexiform layer (IPL) at 6 hours postinjury (hpi) and a decrease herein during axonal regrowth. G-J: Double staining for α-tubulin and Mmp-14 indicates expression of Mmp-14 in/on RGC axons in retinal sections of control sham-operated fish. H-J: High- magnification pictures of double (H) and single (I,J) stainings. K-N: Double labeling of retinal sections for MAP2 and Mmp-14 reveals Mmp-14 expression in IPL neurites at 6 hpi. L-N: High- magnification pictures of double (L) and single (M,N) stainings. O-P: Additional immunostainings on zebrafish retinal sections at 0 dpi, using two alternative antibodies for MMP-14, RP2-MMP-14, and RP5-MMP-14 (Triple Point Biologics, ATK-MMP-14) confirm Mmp-14 expression in the NFL and IPL neurites. * indicates the ON head. For all immunostainings, DAPI (blue) was used as a nuclear counterstain. ONC, optic nerve crush; hpi, hours postinjury; dpi, days postinjury; NFL, nerve fiber layer; RGCL, retinal ganglion cell layer; IPL, inner plexiform layer; INL, inner nuclear layer; OPL, outer plexiform layer; ONL, outer nuclear layer; PRL, photoreceptor layer. Scale bars = 20 �m in C-G,K; 5 �m in H-J,L-N; 50 �m in O-P. |
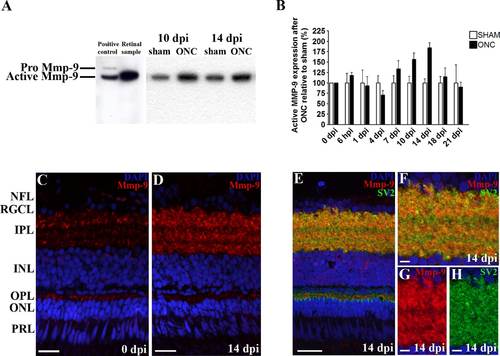
Figure 8. Retinal spatiotemporal expression pattern of Mmp-9 protein after ONC in adult zebrafish. A: Representative picture showing presence of active Mmp-9 in zebrafish retinal extracts, as confirmed by labeling of both pro (92 kDa) and active (76 kDa) Mmp-9 in zebrafish embryo lysates (left). A,B: Western blotting for Mmp-9 on retinal extracts at different timepoints postinjury indicates a peak in active Mmp-9 expression at 14 dpi compared to sham-operated controls. Data represent at least three retinal samples per timepoint and are shown as mean � SEM (*P < 0.05). C,D: Immunostainings for Mmp-9 on retinal sections show an increased Mmp-9 signal in three prominent IPL strata at 14 dpi. E-H: Double staining with SV2 confirms expression of Mmp-9 in a subset of IPL synapses. F-H: High-magnification pictures of double (F) and single (G,H) stainings. For all immunostainings, DAPI (blue) was used as a nuclear counterstain. ONC, optic nerve crush; dpi, days postinjury; NFL, nerve fiber layer; RGCL, retinal ganglion cell layer; IPL, inner plexiform layer; INL, inner nuclear layer; OPL, outer plexiform layer; ONL, outer nuclear layer; PRL, photoreceptor layer. Scale bars = 20 �m in C-E; 5 �m in F-H. |