
|
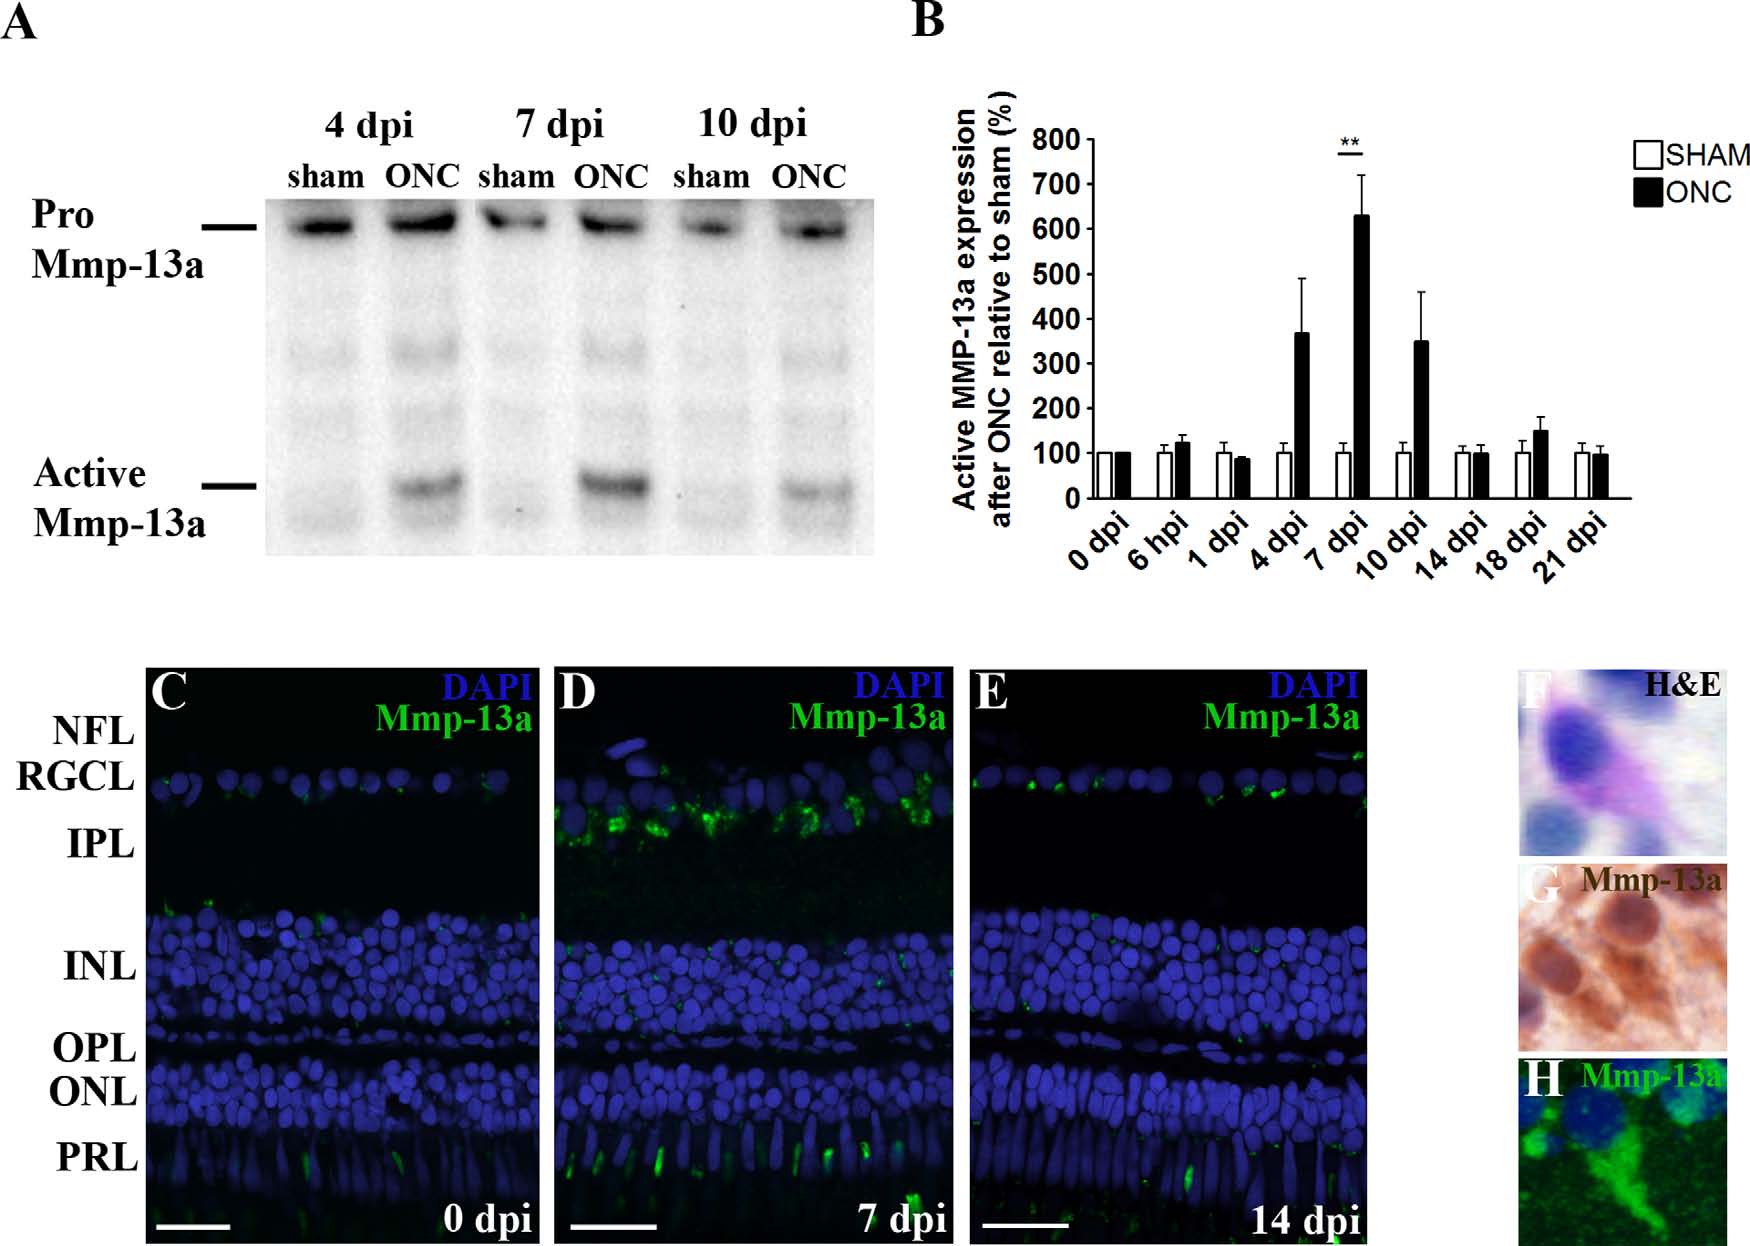
Fig. 4
Retinal spatiotemporal expression pattern of Mmp-13a protein after ONC in adult zebrafish. A,B: Representative picture and bar graph revealing western blotting analysis data for Mmp-13a on retinal extracts after ONC, showing significantly increased active Mmp-13a (45 kDa) levels at 7 dpi, represented as a relative percentage to sham-operated values. No differences in pro Mmp-13a (80 kDa) were observed. Data were collected from at least three retinal samples per timepoint and are shown as mean � SEM (**P < 0.005). C-E: Immunohistochemical stainings for Mmp-13a on retinal sections of sham-operated fish and fish with ONC, show an elevated Mmp-13a signal in the RGCL at 7 dpi, during axonal regrowth. DAPI (blue) was used as nuclear counterstain. F-H: High-magnification photographs of the RGCs after H&E, DAB, or immunofluorescent staining for Mmp-13a, altogether indicating expression of Mmp-13a in RGC somata and primary dendrites after ONC. DAPI (blue) or hematoxylin was used as nuclear counterstain. ONC, optic nerve crush; dpi, days postinjury; NFL, nerve fiber layer; RGCL, retinal ganglion cell layer; IPL, inner plexiform layer; INL, inner nuclear layer; OPL, outer plexiform layer; ONL, outer nuclear layer; PRL, photoreceptor layer. Scale bars = 20 �m.