- Title
-
Single cell analysis of endothelial morphogenesis in vivo
- Authors
- Yu, J.A., Castranova, D., Pham, V.N., Weinstein, B.M.
- Source
- Full text @ Development
|
Complex cellular architecture and behavior of ECs in the developing zebrafish trunk. (A) Schematic of a zebrafish embryo illustrating the position of trunk vessels imaged in B. (B) Confocal image of trunk ISVs and DLAVs in a 48hpf Tg(fli1a:egfp)y1 embryo. (C) Confocal image time series of a single growing trunk ISV sprout in a Tg(fli1a:nls-egfp)y7; Tg(kdrl:mcherry-caax)y171 double-transgenic embryo at 31 (i), 34 (ii), 37 (iii) and 40 (iv) hpf. The mCherry-positive ECs are in gray, while eGFP-positive EC nuclei are highlighted in red, blue and green. (D) Quantitative measurement of the dorsal-ventral position [distance from the dorsal aorta] of each of the endothelial nuclei in C, measured every 10min over a 10 h timecourse. The arrowhead shows where two EC nuclei exchanged positions in the vessel segment and the arrow shows where a nuclear division occurred. DA, dorsal aorta; DLAV, dorsal longitudinal anastomotic vessel; ISV, intersegmental vessel. Scale bar: 20Ám. |
|
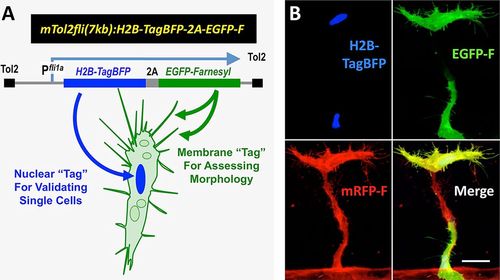
Design and validation of an expression cassette for analyzing the morphology and dynamics of individual ECs within developing vessels. (A) The Tol2(fli1a:H2B-TagBFP-p2A-egfp-F) transgene construct for simultaneously marking endothelial nuclei (with H2B-TagBFP) and EC internal and plasma membranes (with eGFP-farnesyl). (B) Confocal micrograph of a growing trunk ISV/DLAV segment in a 32hpf Tg(kdrl:mRFP-F)y286 embryo injected with a Tol2(fli1a:H2B-TagBFP-p2A-egfp-F) transgene, showing blue, green and red fluorescent channels and all three merged. This segment contains two individual transgene-labeled ECs (as indicated by the presence of a single H2B-TagBFP nucleus in each). eGFP-F fluorescence is concentrated on the cell surface as well as on internal membranes, although not readily evident in this low-magnification reconstructed image. Scale bar: 20Ám. |
|
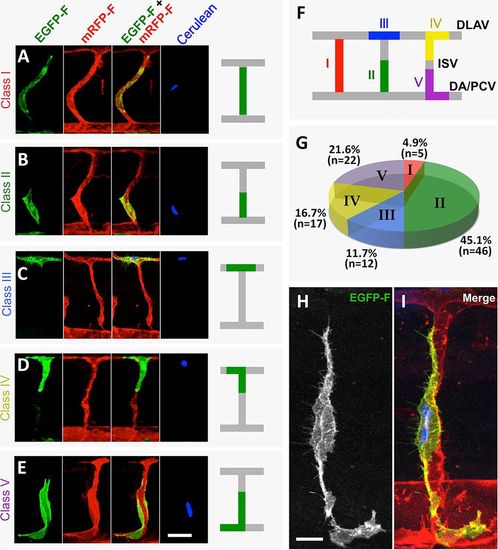
Heterogeneous morphology of individual ECs in newly forming ISV/DLAV segments. (A-E) Representative confocal micrographs of verified single Tol2(fli1a:H2B-TagBFP-p2A-egfp-F) transgene-expressing ECs in trunk ISV/DLAV segments in a 42hpf Tg(kdrl:mRFP-F)y286 germline transgenic embryo, showing green, red, red/green merge and blue fluorescent channels. (F) Morphological classification of ECs contributing to the ISV/DLAV. Class I, extending along an entire ascending ISV segment (see A); Class II, extending partially along an entire ascending ISV (see B); Class III, exclusively in the DLAV (see C); Class IV, in both DLAV and ISV (see D); Class V, in both DA and ISV (see E). (G) Quantification of the proportion of ECs found in each of the five morphological classes. (H,I) High-magnification GFP fluorescence (H) and merged GFP/BFP/RFP fluorescence (I) images of a representative verified single Tol2(fli1a:H2B-TagBFP-p2A-egfp-F) transgene-expressing EC in a trunk ISV segment in a 42hpf Tg(kdrl:mRFP-F)y286 germline transgenic embryo, showing the morphological complexity of the cell, with fine processes extending up and down the vessel segment past the main part of the EC body. PCV, posterior cardinal vein. Scale bars: 20Ám in A-E; 10Ám in H,I. |
|
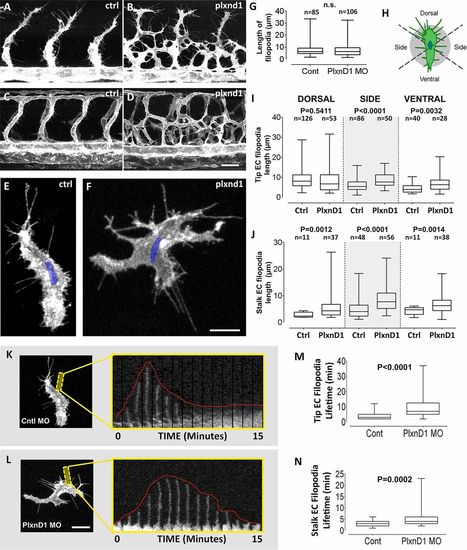
Measuring endothelial protrusiveness, polarity and dynamics using single-EC imaging in vivo. The spatial distribution of filopodia in individual ECs is polarized during normal ISV network patterning. (A-D) Confocal images of mid-trunk vessels in 30 (A,B) or 42 (C,D) hpf in Tg(fli1a:egfp)y1 control (A,C) or plxnd1 (B,D) morpholino-injected embryos, showing disorganization of the ISV network in Plxnd1-deficient animals. (E,F) Higher magnification confocal micrographs of verified single Tol2(fli1a:H2B-TagBFP-p2A-egfp-F) transgene-expressing ECs in the trunks of <30hpf Tg(kdrl:mRFP-F)y286 control (E) or plxnd1 (F) morpholino-injected embryos. GFP-F fluorescence is in gray, H2B-TagBFP-positive nuclei are in blue. (G) Quantification of the average total length of EC protrusions in ECs from control or plxnd1 morpholino-injected embryos. (H) Diagram showing the quadrants used for assessing the directionality of endothelial protrusions ? dorsal, ventral and side. (I,J) Quantification of the average total length of protrusions from (I) endothelial tip cells (cells at the leading front) and (J) endothelial stalk cells (cells not at the leading front) in control or plxnd1 morpholino-injected embryos grouped by whether they protrude dorsally, to the side or ventrally. The data in G, I and J are collected from six independent experiments. (K,L) Representative confocal kymographs of endothelial protrusions on verified single Tol2(fli1a:H2B-TagBFP-p2A-egfp-F) transgene-expressing ECs in the trunks of <30hpf Tg(kdrl:mRFP-F)y286 control (K) or plxnd1 (L) morpholino-injected embryos. GFP-F fluorescence is in gray, H2B-TagBFP-positive nuclei are in blue. (M,N) Quantification of the average lifetime of protrusions emerging from (M) six endothelial tip cells (cells at the leading front) and (N) six endothelial stalk cells (cells not at the leading front) in control or plxnd1 morpholino-injected embryos. The data in M and N were collected from four independent experiments. Box-and-whisker plots (G,I,J,M,N) represent interquartile range (spanning from first to third quartile with median segment inside) in the box, minimum and maximum values (whiskers) at both ends. P-values were derived by unpaired two-tailed Student′s t-test. n.s., not significant. All images are lateral views with rostral to the left. Scale bars: 25Ám in A-D; 10Ám in E,F,K,L. |
|
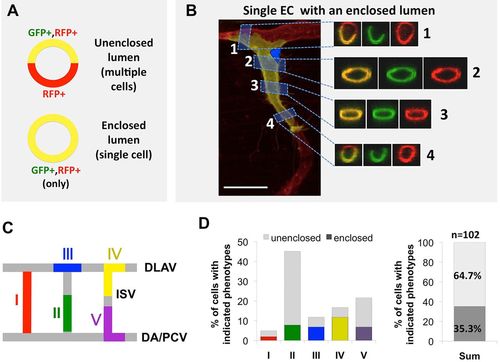
Endothelial lumen heterogeneity revealed by single-cell 3D reconstruction. (A) Schematics showing potential configurations of verified single Tol2(fli1a:H2B-TagBFP-p2A-egfp-F) transgene-expressing ECs adjoining lumenal spaces, in cross-sections of vessels containing these cells from transgene-injected Tg(kdrl:mRFP-F)y286 embryos. Unenclosed lumen: if multiple cells enclose a lumen segment (top), both GFP/RFP double-positive (expressing the injected transgene) and RFP single-positive (not expressing the injected transgene) sectors of the vessel will be detected (see B, 1 and 4). Enclosed lumen: if only a single cell encloses a lumen segment (bottom), the vessel wall will be entirely GFP/RFP double positive (expressing the injected transgene; see B, 2 and 3). (B) Confocal images of a verified single Tol2(fli1a:H2B-TagBFP-p2A-egfp-F) transgene-expressing EC (yellow) in the dorsal part of a Tg(kdrl:mRFP-F)y286 vessel (red). The left panel shows a lateral view reconstruction of the entire cell, with the single nucleus visible by blue fluorescence. To the right are red/green merge (left), green and red fluorescence images of four image slices. Slices 1 and 4 show lumens bounded by both the injected transgenic EC and other EC(s). Slices 2 and 3 show lumens bounded by only the single injected transgene-positive EC. (C) Morphological classification of ECs contributing to the ISV/DLAV (see Fig. 3 for details). (D) Quantification of the proportion of ECs with unenclosed (gray) or enclosed (colored) lumen found in each of the five morphological classes and in total combined trunk ECs. Scale bar: 20Ám. |
|
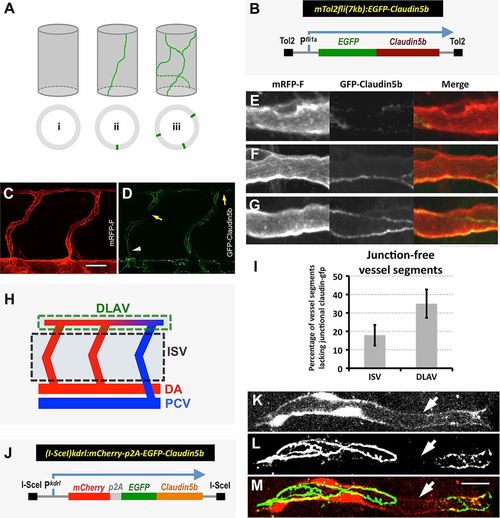
In vivo imaging of EC junctions. (A) Schematic depicting representative junctional morphologies observed in a unicellular endothelial ?seamless? tube lacking junctions along its length (i), a unicellular endothelial tube forming an autocellular junction (ii), and a multicellular endothelial tube with multiple intercellular junctions (iii). (B) Diagram of the Tg(fli1a:egfp-claudin 5b) Tol2 transgene construct used for generating a stable transgenic line marking endothelial junctions. (C,D) Confocal images of mid-trunk vessels in 42hpf Tg(fli1a:egfp-claudin 5b)y287; Tg(kdrl:mRFP-F)y286 double-transgenic embryos, showing eGFP-labeled endothelial tight junctions (D, green) in mRFP-positive ECs (C, red). Blood vessel segments with either no eGFP-Claudin 5b-labeled tight junction or a single line of eGFP-Claudin 5b-labeled tight junctions are highlighted by arrows or arrowhead, accordingly. (E-G) Higher magnification confocal micrographs of mid-trunk vessels in 48hpf Tg(fli1a:egfp-claudin 5b)y287; Tg(kdrl:mRFP-F) y286 double-transgenic embryos, showing vessel segments with a ?gap? in eGFP-Claudin 5b expression (E), with a single line of eGFP-Claudin 5b (F), and with multiple lines of eGFP-Claudin 5b (G). 3D rotations of the merged images in E-G are shown in supplementary material Movies 2-4. (H) Schematic of the trunk vascular network, showing ascending ISV and dorsal DLAV vascular segments that are quantified for the presence or absence of junctions (localized eGFP-Claudin 5b) in I. Arterial vessels (dorsal aorta, intersegmental arteries) are shown in red, venous vessels (posterior cardinal vein, intersegmental veins) are show in blue, and arterial-venous transition zones in the DLAV are denoted with a red-blue gradient. (I) Quantification of the percentage of vessel segments lacking localized eGFP-Claudin 5b expression in the ascending ISV segments or dorsal DLAV segments. (J) Diagram of the Tg(kdrl1:mcherry-p2A-egfp-claudin 5b) I-SceI kdrl transgene construct used for mosaic colabeling of EC membranes (mCherry) and cell-cell junctions (eGFP-Claudin 5b). (K-M) Higher magnification confocal micrographs of a 48hpf embryo injected with a Tol2(kdrl:mcherry-p2A-egfp-claudin 5b) transgene, showing mCherry (K), eGFP (L) and merged (M) fluorescence images. The mCherry-positive segment (K) has eGFP-Claudin 5b (L) localized to the ends but an eGFP-Claudin 5b-negative gap in the center of the segment (arrow). A 3D rotation of the merged image in M is shown in supplementary material Movie 5. All images are lateral views with rostral to the left. Scale bars: 20Ám in C,D; 10Ám in K-M. |
|
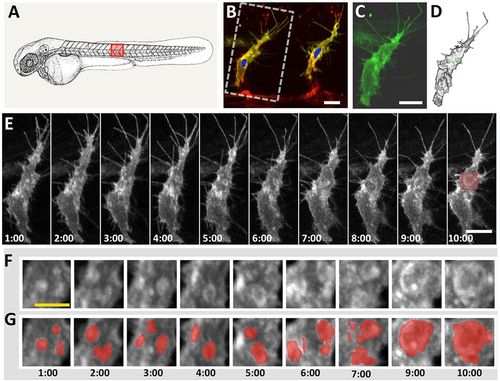
Single-cell analysis of intracellular vacuole fusion during vascular lumenization. (A) Schematic of a zebrafish embryo showing the position of the trunk vessels in B. (B) Confocal micrograph of a verified single Tol2(fli1a:H2B-TagBFP-p2A-egfp-F) transgene-expressing EC in the trunk of an <28hpf Tg(kdrl:mRFP-F)y286 embryo. (C) A single cell (boxed in B) was chosen for time-lapse analysis. (D) Surface-rendered 3D reconstruction of an image stack collected of the cell in C, with intracellular compartments highlighted in green (see supplementary material Movies 7 and 8 for a 3D rotation of the reconstruction and the deconvolved image stack, respectively). (E) Confocal micrograph time series of a verified single Tol2(fli1a:H2B-TagBFP-p2A-egfp-F) transgene-expressing EC in the trunk of a <30hpf Tg(kdrl:mRFP-F)y286 embryo. (F,G) Magnified images of the boxed region in E, with intracellular vesicular/vacuolar compartments highlighted in red in G. Scale bar: 10Ám in B,C,E; 5 Ám in F. |
|
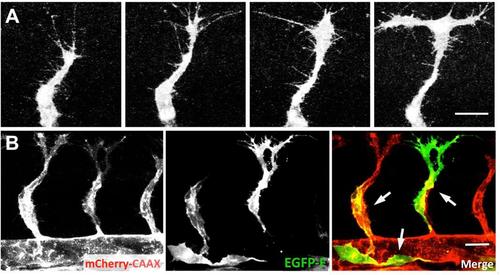
(A) Confocal image time series of a single growing trunk ISV sprout in a Tg(fli1a:EGFP)y1 embryo, showing dynamic changes in sprout morphology over time. (B) Confocal image of growing trunk ISV in a 28 hpf Tg(kdrl:mCherry-caax)y171 embryo injected with a Tol2(fli1a:EGFP-F)y288 transgene. The injected transgene mosaically marks subsets of endothelial cells, but it is not possible to determine whether contiguously labeled endothelium represents one cell or multiple adjacent cells. All images are lateral views with rostral to the left. Scale bars = 20 Ám. |
|
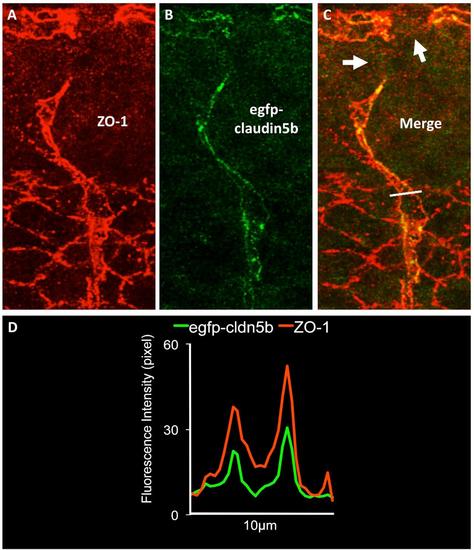
(A-C) Confocal micrograph of whole mount immunohistochemistry of a dorsal trunk ISV/DLAV segment in a 48 hpf Tg(fli1a:egfp-claudin5b)y287 transgenic animal probed with anti-ZO-1 (panels A,C) and anti-EGFP (panels B,C) antibodies. The white line in panel C shows the trace used to measure red (ZO-1) and green (egfp-claudin5b) fluorescence intensity in panel D. (D) Fluorescent pixel intensity of egfp-claudin5b (green) and ZO-1 (red) along the line shown in panel C. Scale bar = 10 Ám. |
|
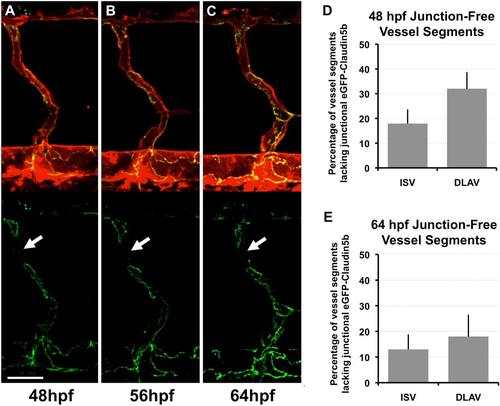
(A-C) Confocal micrographs of mRFP/EGFP (top; EC membranes in red and junctions in green) and EGFP (bottom; junctions in green) fluorescence in the same vascular segments in a Tg(fli1a:egfp-claudin5b)y287; Tg(kdrl:mRFP-F)y286 double transgenic animal at 48 hpf (A), 56 hpf (B), and 64 hpf (C). Tight junction-free vessel segments (arrows) persist for at least a day after intersegmental vessel lumenization. (D,E) Quantification of the percentage of vessel segments lacking junctional EGFP-Claudin5b, measured in the same Tg(fli1a:egfp-claudin5b)y287; Tg(kdrl:mRFP-F)y286 double transgenic animals at 48hpf (D) and 64 hpf (E). Although junction-free segments persist, the overall length of these segments does decrease over time. Scale bar = 20 Ám. |
|
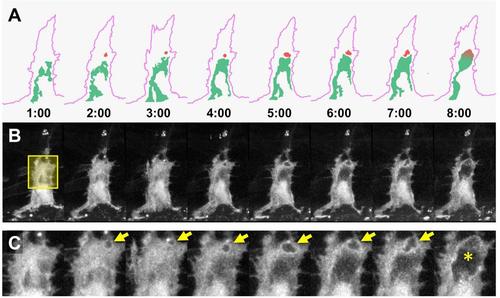
(A) Schematic diagrams illustrating the emergence and enlargement of an intracellular vacuole (red), and its eventual fusion with an extracellular nascent lumen (green) within an intersegmental vessel sprout (outlines in lavender). Elapsed time in minutes is noted. Diagrams correspond to the images below in panels (B) and (C). (B) Time series of green fluorescence confocal images (shown in grayscale) of an identified single (fli1a:H2B-TagBFP-p2A-eGFP-F) marked endothelial cell in a Tg(kdrl:mcherry-caax)y171 transgenic animal, showing emergence and enlargement of a vacuole and its eventual fusion with an an extracellular nascent lumen. The yellow box overlaid on the first timepoint image shows the region magnified in panel (C). (C) Higher magnification green fluorescence confocal close-up views (shown in grayscale) of the timeseries shown in panel B. Arrows note the position of the newly formed vacuole, while the asterisk marks the compartment into which the vacuole merges in the final image frome. See Supp. Movie 9 for an animation of the time series in panels B and C. |


