
|
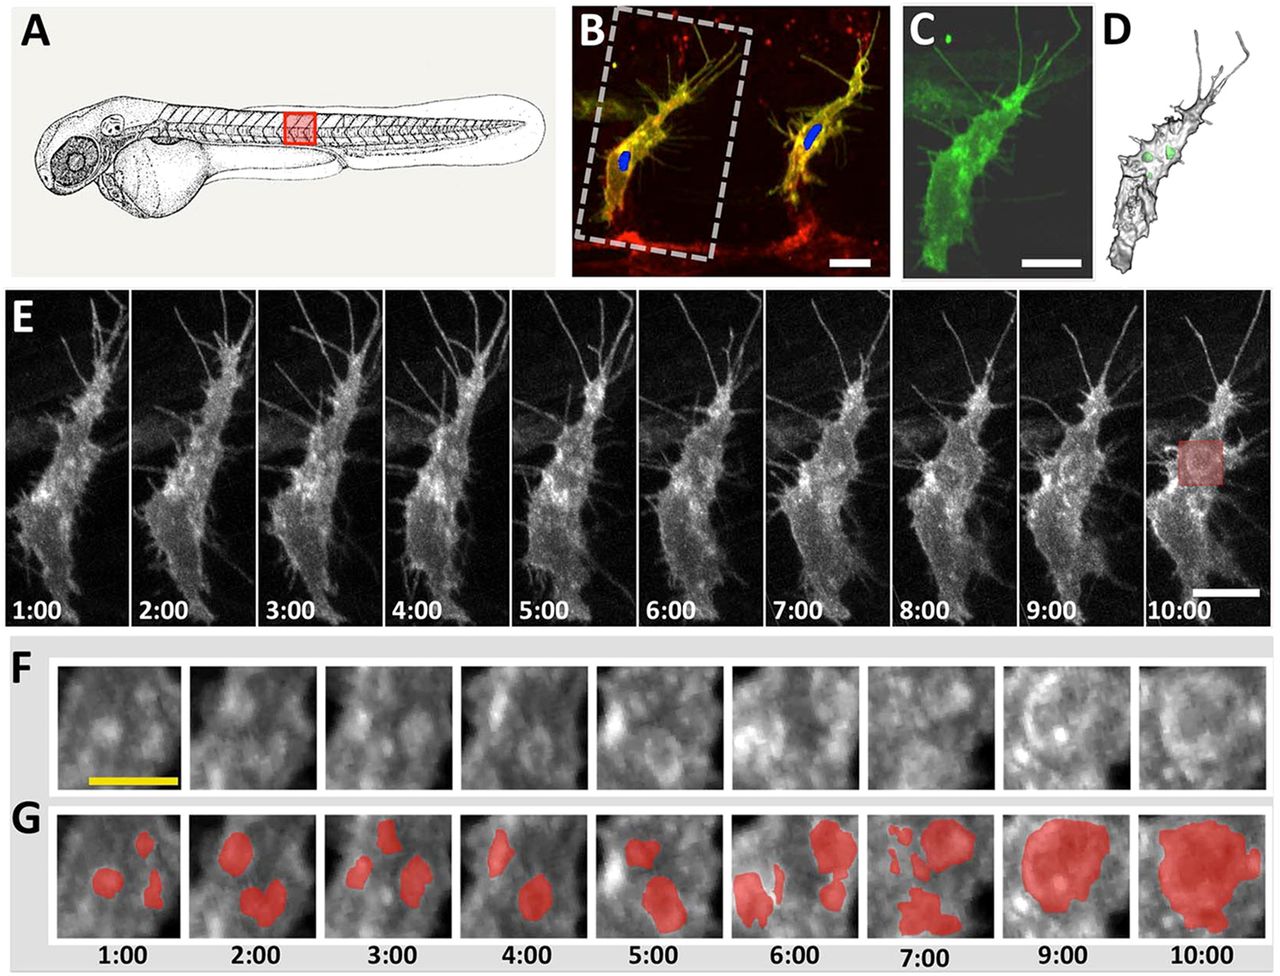
Fig. 7
Single-cell analysis of intracellular vacuole fusion during vascular lumenization. (A) Schematic of a zebrafish embryo showing the position of the trunk vessels in B. (B) Confocal micrograph of a verified single Tol2(fli1a:H2B-TagBFP-p2A-egfp-F) transgene-expressing EC in the trunk of an <28hpf Tg(kdrl:mRFP-F)y286 embryo. (C) A single cell (boxed in B) was chosen for time-lapse analysis. (D) Surface-rendered 3D reconstruction of an image stack collected of the cell in C, with intracellular compartments highlighted in green (see supplementary material Movies 7 and 8 for a 3D rotation of the reconstruction and the deconvolved image stack, respectively). (E) Confocal micrograph time series of a verified single Tol2(fli1a:H2B-TagBFP-p2A-egfp-F) transgene-expressing EC in the trunk of a <30hpf Tg(kdrl:mRFP-F)y286 embryo. (F,G) Magnified images of the boxed region in E, with intracellular vesicular/vacuolar compartments highlighted in red in G. Scale bar: 10�m in B,C,E; 5 �m in F.