
|
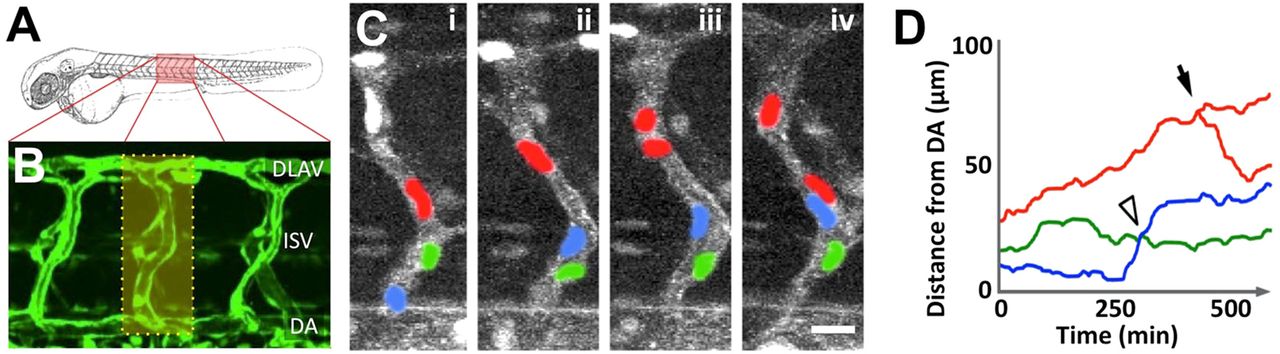
Fig. 1
Complex cellular architecture and behavior of ECs in the developing zebrafish trunk. (A) Schematic of a zebrafish embryo illustrating the position of trunk vessels imaged in B. (B) Confocal image of trunk ISVs and DLAVs in a 48hpf Tg(fli1a:egfp)y1 embryo. (C) Confocal image time series of a single growing trunk ISV sprout in a Tg(fli1a:nls-egfp)y7; Tg(kdrl:mcherry-caax)y171 double-transgenic embryo at 31 (i), 34 (ii), 37 (iii) and 40 (iv) hpf. The mCherry-positive ECs are in gray, while eGFP-positive EC nuclei are highlighted in red, blue and green. (D) Quantitative measurement of the dorsal-ventral position [distance from the dorsal aorta] of each of the endothelial nuclei in C, measured every 10min over a 10 h timecourse. The arrowhead shows where two EC nuclei exchanged positions in the vessel segment and the arrow shows where a nuclear division occurred. DA, dorsal aorta; DLAV, dorsal longitudinal anastomotic vessel; ISV, intersegmental vessel. Scale bar: 20�m.