- Title
-
zebraflash transgenic lines for in vivo bioluminescence imaging of stem cells and regeneration in adult zebrafish
- Authors
- Chen, C.H., Durand, E., Wang, J., Zon, L.I., and Poss, K.D.
- Source
- Full text @ Development
|
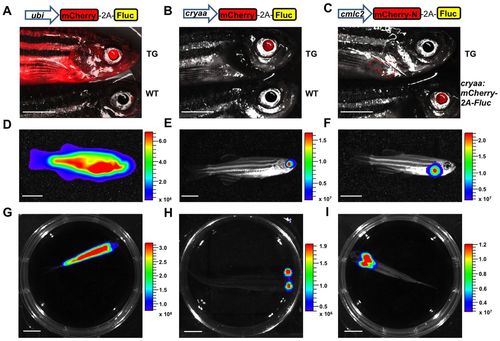
Ubiquitous and tissue-specific luciferase-based transgenic zebrafish lines. (A-C) Constructs and representative fluorescence images of ubi:mCherry-2A-Fluc (A), cryaa:mCherry-2A-Fluc (B) and cmlc2:mCherry-N-2A-Fluc (C) transgenic (TG) fish. The red dashed line indicates the approximate location of the heart. Control fish are shown at the bottom of the images to indicate wild-type (WT; A,B) or cryaa:mCherry-2A-Fluc (C) fluorescence. (D-F) Representative bioluminescence images showing lateral view of ubi:mCherry-2A-Fluc (D), cryaa:mCherry-2A-Fluc (E) and cmlc2:mCherry-N-2A-Fluc (F) fish. (G-I) Representative bioluminescence images from overhead as in D-F. Brightfield and bioluminescence images were captured after luciferin delivery and images were overlaid. Luminescence signals are reported as radiance (p/sec/cm2/sr) with a color bar. Scale bars: 5 mm. |
|
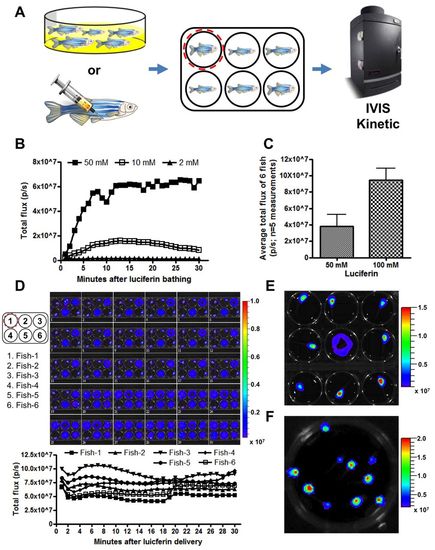
Quantitative luciferase imaging in freely moving adult zebrafish. (A) Scheme of luciferin delivery and imaging. Bioluminescence from the region of interest (ROI; red dashed line) was measured over 20 minutes and expressed as p/sec. (B) Kinetics of bioluminescence recorded immediately after luciferin delivery. Luciferin (2 mM, 10 mM and 50 mM) was delivered to fish by bath incubation. (C) Comparison of average bioluminescence after delivery of 50 mM or 100 mM luciferin. Luciferin was delivered to the same set of fish (n=6) over five rounds of independent measurements (mean ± s.d.). (D) Bioluminescence recorded during the plateau phase from six freely moving fish over 30 minutes (1 minute/frame ×30) after luciferin delivery. (Top) Trace of bioluminescence in multi-well plates indicating the activity level of the animal during imaging. (Bottom) Bioluminescence recorded from Individual animals. (E) Representative bioluminescence images of nine freely moving adult cmlc2:mCherry-N-2A-Fluc animals inside an imaging chamber. (F) Snapshot of a movie of ten swimming 4-week-old juvenile cmlc2:mCherry-N-2A-Fluc animals, indicating cardiac bioluminescence. Luminescence signals are reported as radiance (p/sec/cm2/sr) with a color bar. |
|
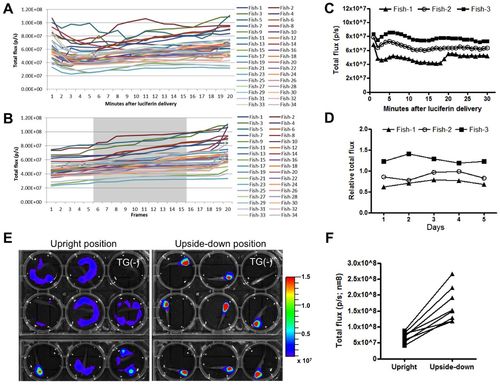
Multiplex imaging of adult zebrafish. (A,B) Bioluminescence recorded during the plateau phase from 34 freely moving adult cmlc2:mCherry-N-2A-Fluc zebrafish over 20 minutes (1 minute/frame ×20) (A). Recorded data were sorted from lowest to highest initial readings. Ten median values from a total of 20 recorded values were averaged (gray areas) and then used for comparison across different animals (B). (C) Representative bioluminescence recorded during the plateau phase from three adult zebrafish after luciferin delivery, indicating that relative signal strength could vary between animals. (D) Relative total flux over 5 days of daily independent measurements, indicating consistency within individual animals. (E) Representative bioluminescence images of animals in either an upright or upside-down position. (Top) Brightfield only; (bottom) brightfield and bioluminescence images overlaid. TG(-), a transgene-negative control animal. Luminescence signals are reported as radiance (p/sec/cm2/sr) with a color bar. (F) Bioluminescence recorded from the same animals in different positions, indicating that the posture of the animals during imaging affects the measured bioluminescence up to 2-fold (n=9). |
|
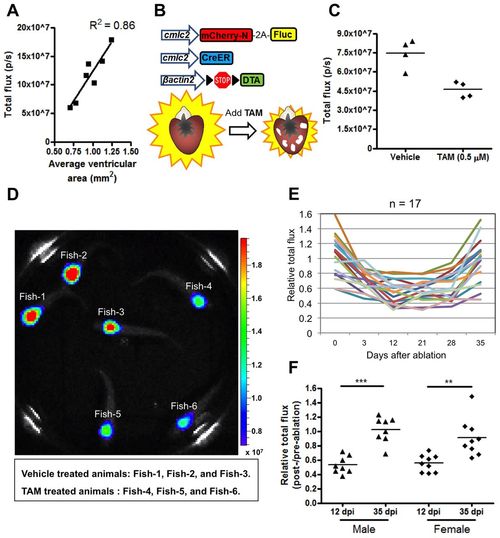
Longitudinal monitoring of heart regeneration by luciferase imaging. (A) Correlation between bioluminescence (p/sec) and the surface area of tissue sections from adult ventricles. One representative experiment is shown here from two experiments. (B) Cardiac ablation/detection constructs and injury. TAM, tamoxifen. (C) Bioluminescence recorded 10 days after induced genetic cardiomyocyte ablation. One representative experiment is shown here from three replicate experiments. (D) Snapshot of a movie of six swimming adult triple-transgenic animals from these experiments, at 10 days post-treatment. Three have received tamoxifen and have lower bioluminescence signals (Fish-4, Fish-5 and Fish-6) than vehicle-treated animals (Fish-1, Fish-2 and Fish-3). Luminescence signals are reported as radiance (p/sec/cm2/sr) with a color bar. (E) Relative total flux indicating changes in bioluminescence in 17 animals during the course of injury and regeneration. (F) Relative total flux showing increases in bioluminescence between 12 days and 35 days after tamoxifen treatment. Animals are grouped here by sex. ***P<0.001, **P<0.01, paired Student?s t-test. dpi, days post-injury. |
|
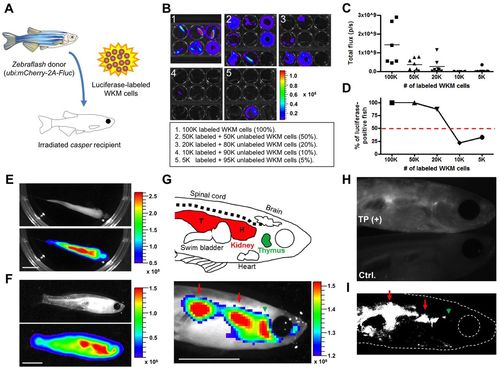
Luciferase-based live imaging after hematopoietic stem cell transplantation. (A) Scheme of marrow transplantation experiments. (B) Representative bioluminescence images of swimming recipient fish transplanted with different ratios of ubi:mCherry-2A-Fluc WKM cells. (C) Bioluminescence reading from recipient fish at 30 days post-transplant (n=6-9 per group). (D) Percentage of recipients with any above-background bioluminescence at 30 days post-transplant. (E,F) Representative bioluminescence images of a freely moving recipient fish, viewed overhead (E) or laterally (F) under anesthesia. (G) (Top) Depiction of the internal anatomy of an adult zebrafish. (Bottom) Representative bioluminescence image of a recipient fish, at high magnification and a higher threshold setting, indicating signals from key hematopoietic stem cell colonization sites. Red arrows indicate the location of trunk kidney (T) and head kidney (H); the green arrowhead points to the thymus. (H,I) Fluorescence images (H) were acquired from the same recipient fish shown in G, along with a non-recipient animal (Ctrl.). Background fluorescence signal was subtracted by ImageJ with a higher threshold setting to reveal signals from key hematopoietic stem cell colonization sites (I). Luminescence signals are reported as radiance (p/sec/cm2/sr) with a color bar. Scale bars: 5 mm. |
|
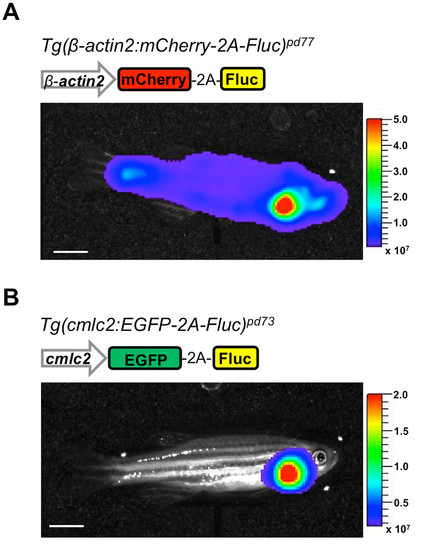
Additional transgenic lines generated in this study. (A,B) Representative bioluminescence images showing the lateral view of a β-actin2:mCherry-2A-Fluc fish (A) and a cmlc2:EGFP-2A-Fluc fish (B). Scale bars, 5 mm. |
|
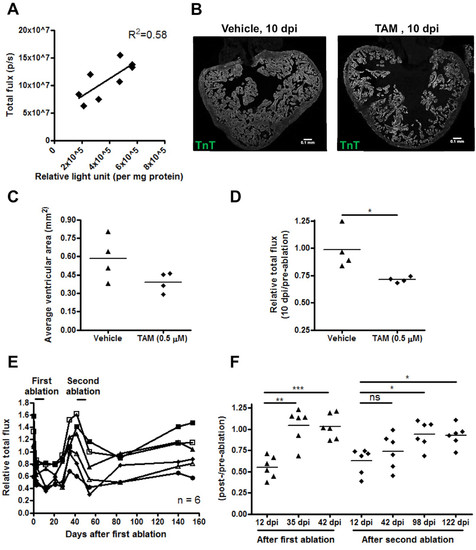
Reduced bioluminescence correlated with loss of cardiac tissue. (A) Graph indicates a positive correlation between in vivo bioluminescence (p/s) and in vitro luciferase activity measured in ventricular tissue extracts. (B) Representative ventricular sections from vehicle- (left) and tamoxifen-treated (right) cmlc2:mCherry-N-2A-Fluc; Z-CAT zebrafish, stained for cardiac Troponin T. (C) Quantification of cardiac Troponin T -positive tissue in ventricular sections. (D) Chen, page 6 Relative total flux from either vehicle- or tamoxifen-treated Z-CAT zebrafish. *P < 0.05; Unpaired Student?s t-test. (E) Relative total flux showing changes in bioluminescence after first and second induced cardiomyocyte ablations (n = 6). (F) Relative total flux showing increases in bioluminescence after first and second induced cardiomyocyte ablations. ***P < 0.001; **P < 0.01; *P < 0.05; ns: non-significant; Paired Student?s t-test. |
|
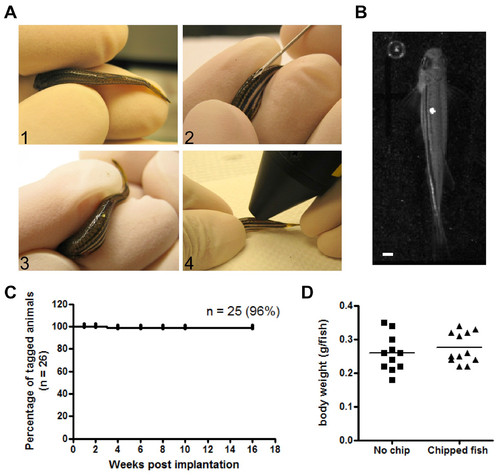
Tagging individual adult zebrafish with p-Chips. (A) Tagging procedure for an adult zebrafish. (1-3) Sequential steps showing a p-Chip was implanted into the left dorsal trunk muscle (white dot in image 3). (4) Implanted p-Chip was read using a laser-emitting wand. (B) Representative bright field images showing the overhead view of a freely moving adult zebrafish tagged with a p-Chip. Scale bars, 1 mm. (C) Percentage of tagged animals over 16 weeks of monitoring after p-chips implantation (n = 26). (D) Body weight of the animals recorded one month after tagging, indicating no obvious impact on animal health. |

