
|
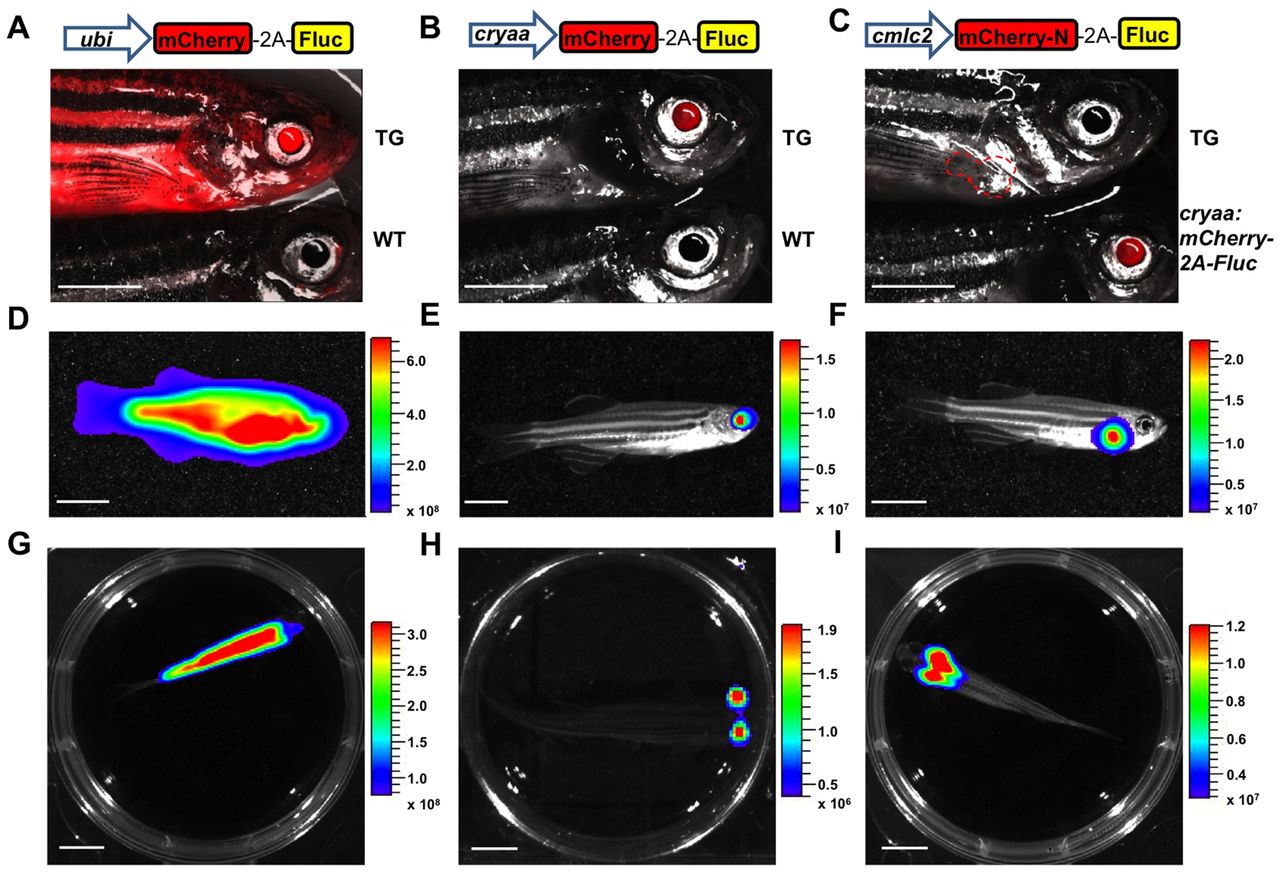
Fig. 1
Ubiquitous and tissue-specific luciferase-based transgenic zebrafish lines. (A-C) Constructs and representative fluorescence images of ubi:mCherry-2A-Fluc (A), cryaa:mCherry-2A-Fluc (B) and cmlc2:mCherry-N-2A-Fluc (C) transgenic (TG) fish. The red dashed line indicates the approximate location of the heart. Control fish are shown at the bottom of the images to indicate wild-type (WT; A,B) or cryaa:mCherry-2A-Fluc (C) fluorescence. (D-F) Representative bioluminescence images showing lateral view of ubi:mCherry-2A-Fluc (D), cryaa:mCherry-2A-Fluc (E) and cmlc2:mCherry-N-2A-Fluc (F) fish. (G-I) Representative bioluminescence images from overhead as in D-F. Brightfield and bioluminescence images were captured after luciferin delivery and images were overlaid. Luminescence signals are reported as radiance (p/sec/cm2/sr) with a color bar. Scale bars: 5 mm.