
|
Fig. S3
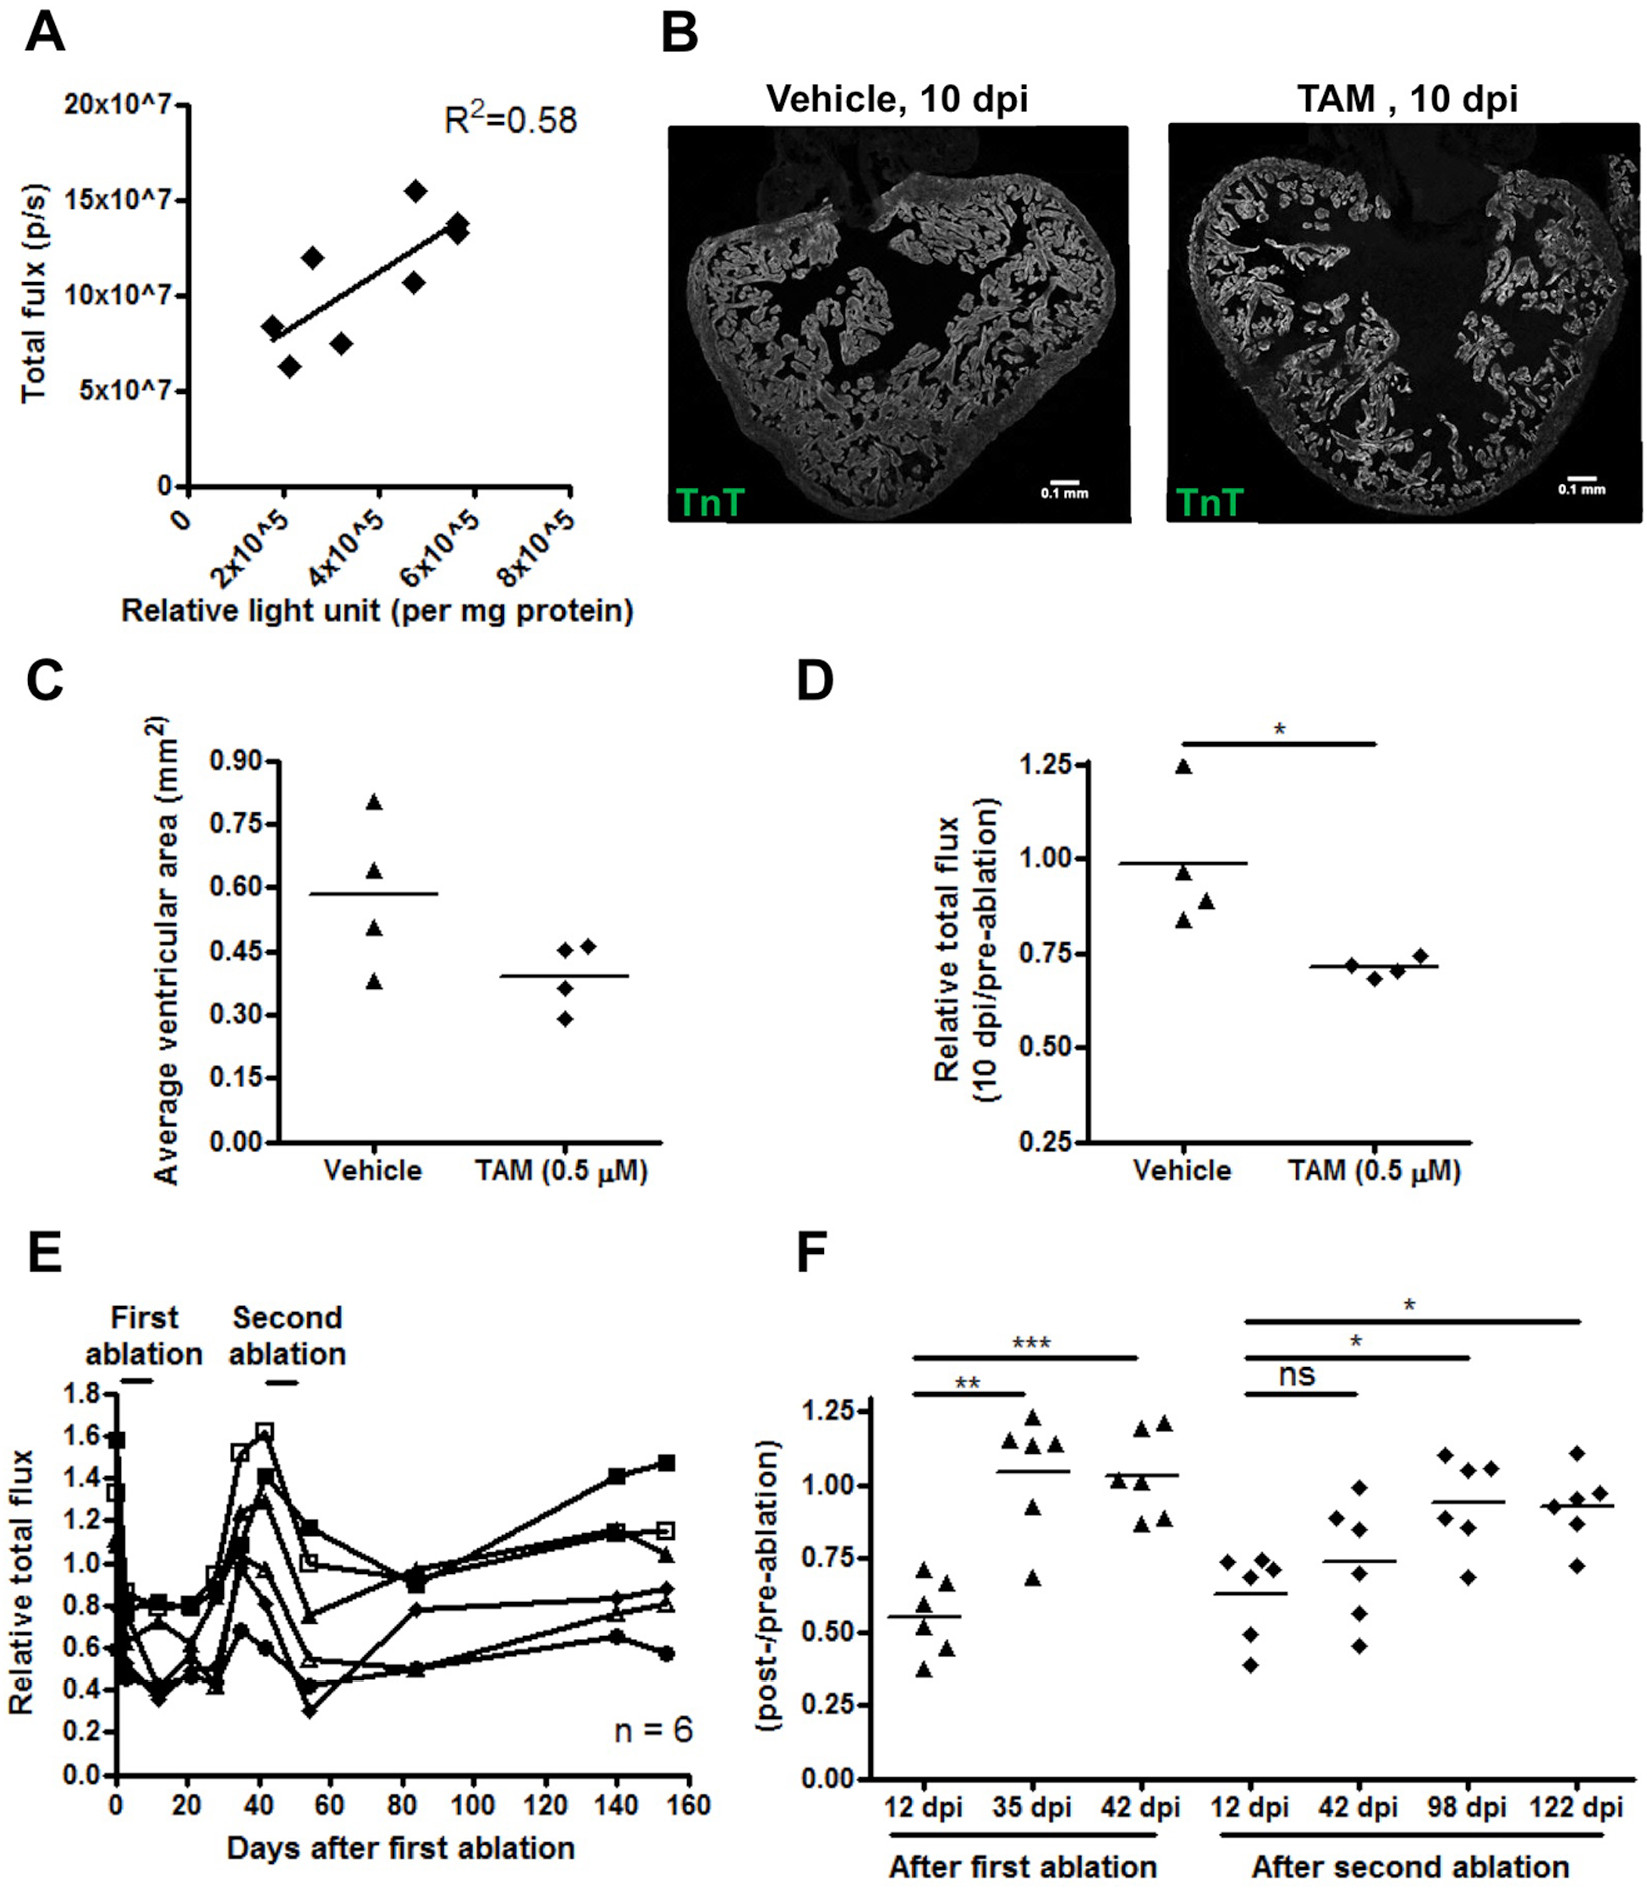
Reduced bioluminescence correlated with loss of cardiac tissue. (A) Graph indicates a positive correlation between in vivo bioluminescence (p/s) and in vitro luciferase activity measured in ventricular tissue extracts. (B) Representative ventricular sections from vehicle- (left) and tamoxifen-treated (right) cmlc2:mCherry-N-2A-Fluc; Z-CAT zebrafish, stained for cardiac Troponin T. (C) Quantification of cardiac Troponin T -positive tissue in ventricular sections. (D) Chen, page 6 Relative total flux from either vehicle- or tamoxifen-treated Z-CAT zebrafish. *P < 0.05; Unpaired Student?s t-test. (E) Relative total flux showing changes in bioluminescence after first and second induced cardiomyocyte ablations (n = 6). (F) Relative total flux showing increases in bioluminescence after first and second induced cardiomyocyte ablations. ***P < 0.001; **P < 0.01; *P < 0.05; ns: non-significant; Paired Student?s t-test.