- Title
-
Dcc Regulates Asymmetric Outgrowth of Forebrain Neurons in Zebrafish
- Authors
- Gao, J., Zhang, C., Yang, B., Sun, L., Zhang, C., Westerfield, M., and Peng, G.
- Source
- Full text @ PLoS One
|
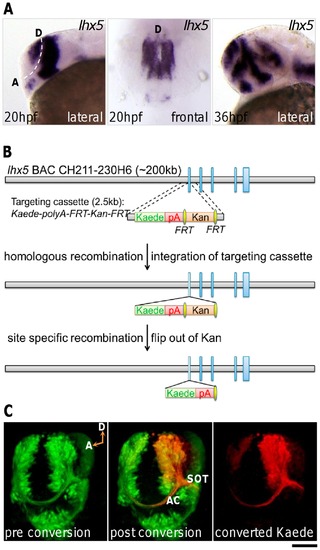
ADt neurons project axons ventrally. In this and subsequent figures, the probes used for whole-mount in situ hybridization are listed in the upper right corner of each panel. Developmental stages are indicated in the lower left corners. Lateral, animals mounted in lateral view, rostral to the left; Frontal, animals mounted in frontal view, dorsal to the top. (A) lhx5 is expressed in the anterior dorsal region of the telencephalon. Dashed line marks the telencephalon-diencephalon border. D: dorsal; A: anterior ventral. Scale bar: 100 μm for lateral view; 60 μm for frontal view. (B) BAC modification via recombination methods. Vertical blue bars represent exons of the lhx5 gene. The Kaede expression cassette replaced the first exon of lhx5 gene. pA: polyadenylation signal sequence; Kan: kanamycin resistant marker; FRT, flippase recognition target. (C) Photo-conversion of Kaede in Tg(lhx5BAC:Kaede) transgenic embryos demonstrates ADt neurons project axons ventrally into the AC and SOT. A live Tg(lhx5BAC:Kaede) transgenic animal was mounted in tilted frontal view to reveal the AC and SOT simultaneously. The region of the left telencephalon was selected for photoconversion. D: dorsal; A: anterior ventral; AC: anterior commissure; SOT: supraoptic tract. Scale bar: 60 μm. EXPRESSION / LABELING:
|
|
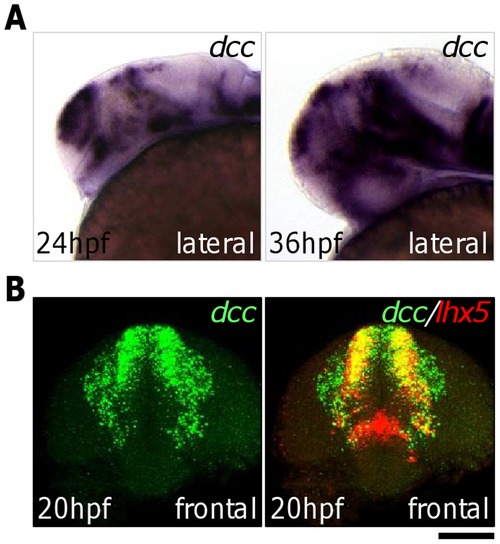
Expression patterns of dcc and netrin. (A) dcc is expressed in the dorsal telencephalic region at 24 hpf and 36 hpf. (B) dcc and lhx5 are co-expressed in the dorsal telencephalon at 20 hpf. ADt neurons are migrating from their medial positions in the neural tube to lateral positions at 20 hpf. Scale bar: 100 μm for lateral view; 60 μm for frontal view. EXPRESSION / LABELING:
|
|
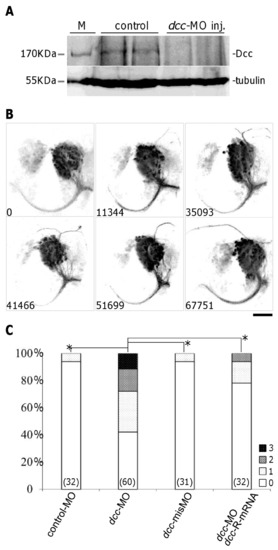
Dcc is required for correct asymmetric outgrowth of ADt neuronal axons. (A) Dcc expression was reduced after injection of dcc translation-blocking morpholinos into zebrafish embryos. Endogenous Dcc protein was detected as a band of approximately 170 kb. Tubulin served as a loading control. M: size marker. (B) ADt neurons project axons dorsally when Dcc function is inhibited by morpholino injection. Images of live animals were acquired as in Fig. 1C. The pixel intensity value of aberrant axon is shown in the bottom left corner of each panel. Scale bar = 50 Ám. (C) Quantitation of ADt neuronal axon defects. Horizontal axis shows the treatment group labels and vertical axis shows the percentage of embryos in each phenotypic category (Grade 0?3) for each treatment group. Numbers inside parentheses denote numbers of animals analyzed for each treatment group. Asterisks and brackets represent p<0.05 by Mann-Whitney U test. PHENOTYPE:
|
|
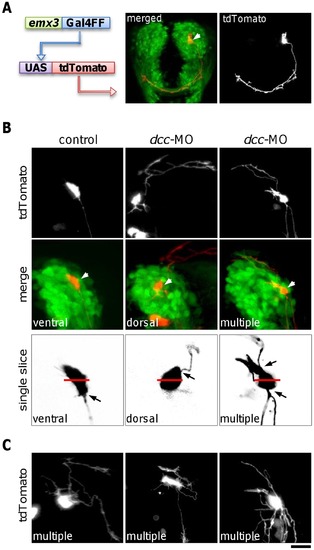
Inhibition of Dcc function causes ADt axons to project dorsally or to form multiple processes. (A) Labeling of individual ADt neurons by mosaic expression of fluorescent protein tdTomato. Image of a live 36 hpf Tg(lhx5BAC:Kaede) animal that was injected with emx3:Gal4FF and UAS:tdTomato plasmids is shown. The tdTomato labeled neuron projected an axon into the AC. Merge panel shows the position of the tdTomato labeled soma (marked by an arrowhead). Scale bar = 50 μm. (B) Injection of dcc morpholino causes ADt neurons to project axons dorsally or to form multiple processes. Labeled ADt neurons are marked by arrowheads in the merged panels. Left panels show an ADt neuron with a normal ventrally projecting axon in a control animal. Middle panels show an ADt neuron with an aberrant dorsally projecting axon in a dcc-MO injected animal. Right panels show an ADt neuron with both ventrally and dorsally projecting processes. Black arrow in the single slice images indicates the origin of the axon on the surface of the cell body. Red bar indicates the middle of the dorsal and the ventral side of the labeled neuron cell body. Scale bar equals to 20 μm in the projected images or 10 μm in the single slice images. (C) Additional examples of ADt neurons with multiple aberrant axons in dcc-MO injected animals. Scale bar = 15 μm. PHENOTYPE:
|
|
Effects of inhibition of Netrin1 or Neogenin1 function on the ADt axons. (A) ADt neurons project axons dorsally when Netrin1 function is inhibited (ntn-MO). Knockdown of Neogenin1 function doesn?t cause ADt neuron to project axon dorsally (neo-MO). Images were processed as in Fig. 3B. The pixel intensity value of aberrant axon is shown in the bottom left corner of each panel. Scale bar = 50 μm. (B) Quantitation of ADt neuronal axon defects. Horizontal axis shows the treatment group labels and vertical axis shows the percentage of embryos in each phenotypic category (Grade 0?3) for each treatment group. Numbers inside parentheses denote numbers of animals analyzed for each treatment group. (C) Synergistic effects between sub-threshold Dcc-Netrin1 and Dcc-Neogenin morpholino knockdowns. dcc-sub_MO and ntn-sub_MO: sub-threshold concentration morpholino. At least three independent injections were performed for each treatment group. Numbers inside parentheses denote numbers of animals analyzed. Asterisks represent p<0.001 by ANOVA test. PHENOTYPE:
|


