- Title
-
Chemokine Signaling Directs Trunk Lymphatic Network Formation along the Preexisting Blood Vasculature
- Authors
- Cha, Y.R., Fujita, M., Butler, M., Isogai, S., Kochhan, E., Siekmann, A.F., and Weinstein, B.M.
- Source
- Full text @ Dev. Cell
|
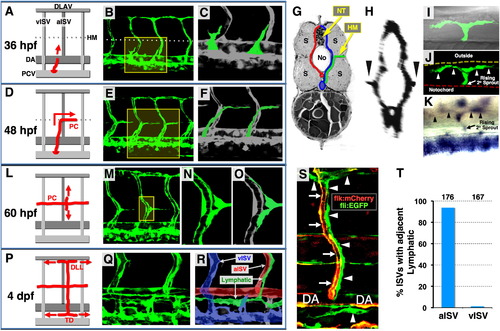
Anatomy and Assembly of the Trunk Lymphatic Network in the Developing Zebrafish (A, D, L, and P) Diagrams illustrating successive steps in trunk lymphatic network assembly at different developmental stages (red, developing lymphatics; red arrows, their growth direction). (B, E, M, and Q) Confocal images of the vasculature in Tg(fli1a:EGFP)y1 animals at each stage (yellow boxes, magnified areas shown to the right). (C, F, N, and O) Magnified views of the boxed portions of the images to the left (green, developing lymphatic vessels, except N). (G) Cross-sectional diagram illustrating lateral growth of lymphatic progenitors (green) toward the superficial HM (red, arterial BVs; blue, venous BVs; No, notochord; NT, neural tube; S, somites). (H) Cross-sectional reconstruction (rotated 90°) of confocal stacks used in (E) (arrowheads, vascular spouts extending laterally along the HM). (I and J) Dorsal view confocal/DIC (I) and confocal only (J) images of a single branching PC sprout (arrowheads) in the superficial HM of a 60 hpf Tg(fli1a:EGFP)y1 larva. (K) Dorsal view image of a branching PC sprout (arrowheads) in the superficial HM of a 56 hpf larva WISH-stained for prox1. (R) Color-coded image of (Q) (green, lymphatic vessels; red, arterial BVs; blue, venous BVs). (S) Confocal image of an aISVs (red/yellow, arrows) with a coaligned ISLV and other developing lymphatics (green, arrowheads) in a 3 dpf Tg(flk:mCherry), Tg(fli1a:EGFP)y1 double transgenic animal. (T) Quantification of aISV and vISV (determined by observing vessels using confocal microscopy at 5 dpf) with a coaligned ISLVs. The total number of aISVs or vISVs counted is shown above each bar. See also Movie S1 and Figure S1. |
|
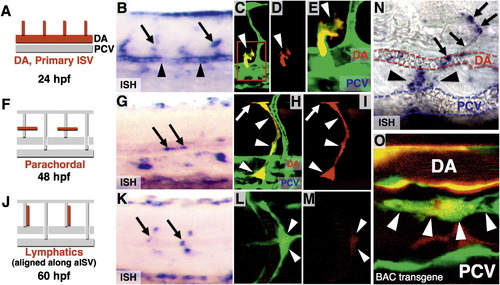
Chemokine Receptor Cxcr4a Expression in the Developing Zebrafish Trunk (A, F, and J) Diagrams indicating Cxcr4a expression domains as red at stages shown below. (B, G, and K) WISH images corresponding to left panels (arrows, Cxcr4a expression domains; arrowheads, Cxcr4a expression in DA at 24 hpf). (C?E) Confocal images of a 35 hpf Tg(fli1a:EGFP)y1 embryo (green) injected with a recombineered BAC clone with TagRFP-T driven by the cxcr4a promoter (red). TagRFP-T is detected in lymphatic progenitors sprouting from the PCV. (C) Merged image. (D) Red channel only. (E) Magnified view in the red box of (C). (H and I) Confocal images of a 45 hpf Tg(fli1a:EGFP)y1 embryo (green) injected with a recombineered BAC clone with TagRFP-T driven by the cxcr4a promoter (red). TagRFP-T is detected in sprouting lymphatic progenitors forming the PC. (H) Merged image. (I) Red channel only. (L and M) Confocal image of a 62 hpf Tg(fli1a:EGFP)y1 embryo (green) injected with a recombineered BAC clone with TagRFP-T driven by the cxcr4a promoter (red). TagRFP-T is detected in LEC migrating dorsally and ventrally from the PC. (L) Merged image. (M) Red channel only. (N) High-magnified WISH image showing a cxcr4a-expressing TD sprout extending along the intersegmental boundary (arrows) and between the DA and PCV (arrowheads) at a 3 dpf animal. (O) Confocal image of ventral trunk vessels in a 5 dpf Tg(fli1a:EGFP)y1 embryo (green) injected with a recombineered BAC clone with TagRFP-T driven by the cxcr4a promoter (red). TagRFP-T expression is present in both TD (arrowheads) and DA, but not in the PCV. See also Figure S2. |
|
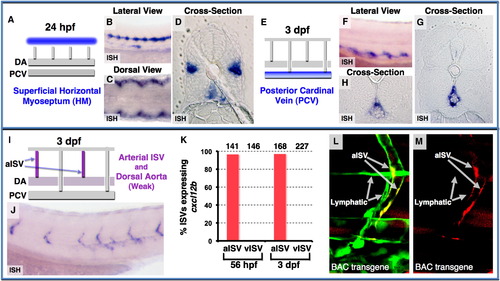
Chemokine Ligand Cxcl12 Expression in the Developing Zebrafish Trunk (A?D) Cxcl12a expression in the superficial HM at 24 hpf, as shown in diagram (blue in A), and in WISH lateral view (B), dorsal view (C), and cross-section (D). (E?H) Cxcl12a expression in the PCV at 3 dpf, as shown in diagram (blue in E), and in WISH lateral view (F) and cross-sections (G and H). (I and J) Cxcl12b expression in the aISV and DA, as shown in diagram (magenta in I) and in WISH lateral view image (J) at 3 dpf. (K) Quantification of aISV and vISV (determined by direction of blood flow and by connection to either the DA or PCV as shown in Movie S2) expressing cxcl12b at 56 hpf and 3 dpf. Numbers of counted aISVs or vISVs at each time point are indicated above the bars. (L and M) Confocal images of mid-to-ventral trunk vessels in a 3 dpf Tg(fli1a:EGFP)y1 embryo (green) injected with a recombineered BAC clone with TagRFP-T driven by the cxcl12b promoter (red), showing green and red fluorescence together (L), or red fluorescence only (M). TagRFP-T expression is present in aISVs, but not in adjacent LVs. See also Figure S3. |
|
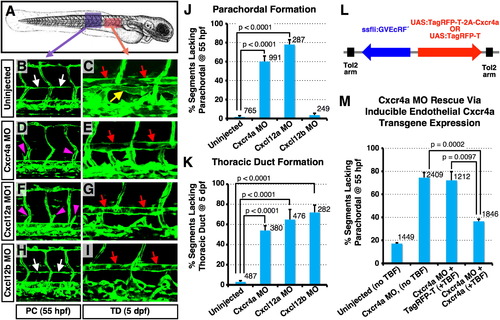
Lymphatic Network Formation Is Disrupted in Chemokine Morphants (A) Diagram of a zebrafish embryo (a purple box, the region shown in B, D, F, and H; a red box, the region shown in C, E, G, and I). (B?I) Confocal images of trunk vessels in 55 hpf (B), (D), (F), and (H) or 5 dpf (C), (E), (G), and (I) Tg(fli-EGFP)y1 embryos that were either not injected, or injected with MOs indicated at left. (J) Quantification of the PC formation defect in 55 hpf MO-injected embryos (as shown in B, D, F, and H). Values are the mean ± SEM. Numbers of counted PC segments are indicated above the bars. (K) Quantification of the TD formation defect in 5 dpf MO-injected embryos (as shown in C, E, G, and I). Values are the mean ± SEM. Numbers of counted TD segments are indicated above the bars. (L) Diagram of Cxcr4a rescue constructs for spatiotemporal overexpression of either TagRFP-T + Cxcr4a or TagRFP-T alone (arrows, direction of gene expression). (M) Quantification of the PC formation defect in control (column 1) or Cxcr4a morphant animals (columns 2?4), some of which were coinjected with transgenes for ecdysone-inducible endothelial-specific overexpression of either TagRFP-T (column 3) or Cxcr4a (column 4). Values are the mean ± SEM. Numbers of counted PC segments are indicated above the bars. White arrows, PC; yellow arrow, TD; red arrows, DA; magenta arrowheads, secondary sprouts migrating to the level of the HM. See also Figure S4. |
|
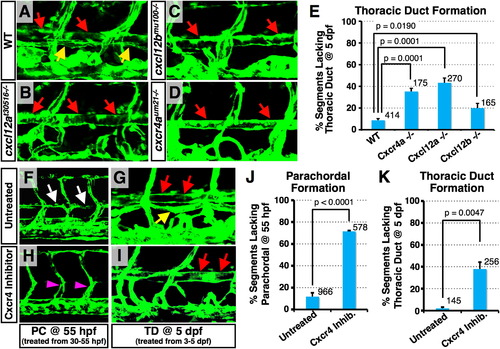
Deficiency of Chemokine Signaling Results in the Loss of Lymphatic Network (A?D) Confocal images of trunk vessels in 5 dpf Tg(fli-EGFP)y1 wild-type (A), cxcl12at30516/ (B), cxcl12bmu100/ (C), and cxcr4aum21/ (D) homozygous mutant animals. Red and yellow arrows indicate DA and TD, respectively. (E) Quantification of TD formation defect in 5 dpf mutant animals. Values are the mean ± SEM. Numbers of counted TD segments are indicated above the bars. (F?I) Confocal images of trunk vessels in 55 hpf Tg(fli-EGFP)y1 animals treated from 30 to 55 hpf (F) and (H) or 5 dpf Tg(fli-EGFP)y1 animals treated from 3 to 5 dpf (G) and (I) with either DMSO vehicle (F) and (G) or Cxcr4 inhibitor (H) and (I). (J) Quantification of the PC formation defect in 55 hpf DMSO vehicle or Cxcr4 inhibitor-treated embryos. Values are the mean ± SEM. (K) Quantification of the TD formation defect in 5 dpf DMSO vehicle or Cxcr4 inhibitor-treated embryos. Values are the mean ± SEM. In (J) and (K), numbers of counted PC or TD segments are indicated above the bars. See also Figure S5. |
|
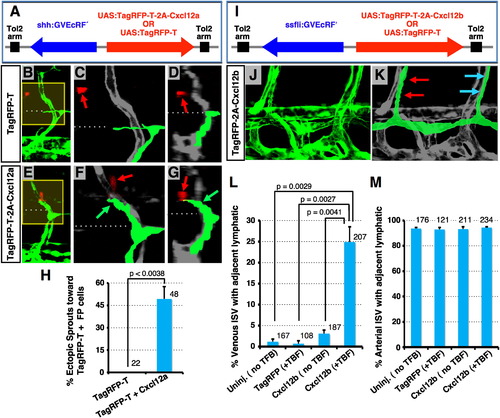
Ectopic Overexpression of Chemokine Ligands Induces Abnormal Migration of LEC (A) Diagram of constructs for spatiotemporal overexpression of either TagRFP-T + Cxcl12a (produced cotranslationally using a viral 2A peptide linker) or TagRFP-T alone (arrows indicate direction of gene expression; see Supplemental Experimental Procedures for details). (B?G) Confocal images of trunk vessels in 55 hpf Tg(fli-EGFP)y1 embryos injected with constructs as shown in (A) and treated with TBF from 30 hpf (see Supplemental Experimental Procedures). Yellow boxes in (B) and (E) indicate areas magnified in (C) and (F), respectively. Images in (D) and (G) are 3D reconstructed cross-sectional views of the same confocal data shown in (B) and (E), respectively (90° horizontal rotation). Dashed lines mark the level of the HM, where the PC normally forms. Red fluorescence (noted with red arrows) shows neural FP cells expressing TagRFP-T (B)?(D) or TagRFP-T + Cxcl12a (E)?(G). Developing lymphatics are colorized green in (C), (D), (F), and (G). Green arrows in (F) and (G) point to an ectopic lymphatic sprout extending dorsally beyond the HM toward nearby TagRFP-T + Cxcl12a-expressing FP cells. (H) Quantification of ectopic lymphatic sprout migration in segments with TagRFP-T-positive cells in embryos injected with the constructs shown in (A). Values are the mean ± SEM. The total number of secondary sprouts counted is shown above each bar. (I) Diagram of constructs for spatiotemporal overexpression of either TagRFP-T + Cxcl12b or TagRFP-T alone (arrows, direction of gene expression; see Supplemental Experimental Procedures). (J) Confocal image of ventral trunk vessels in a 5 dpf Tg(fli-EGFP)y1 embryo injected with TagRFP-T + Cxcl12b expression construct (shown in I) and treated with TBF from 55 hpf (see Supplemental Experimental Procedures). (K) Same image as in (J) with developing lymphatics colorized green (red arrows, a normal ISLVs adjacent to an aISVs; blue arrows, a mislocalized ISLVs adjacent to a vISVs). (L) Quantification of venous ISVs with an immediately adjacent ISLVs in uninjected embryos or embryos injected with constructs shown in (I) with or without TBF treatment. Values are the mean ± SEM. (M) Quantification of arterial ISVs with an immediately adjacent ISLVs in uninjected embryos or embryos injected with constructs shown in (I), with or without TBF treatment. Values are the mean ± SEM. The total number of vISVs (L) or aISVs (M) counted is shown above each bar. See also Figure S6. |
|
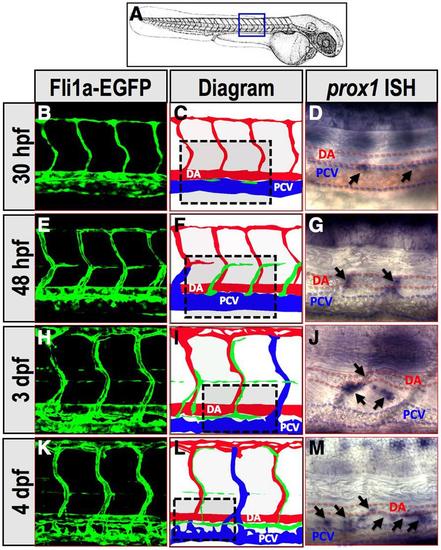
(related to Figure 1). prox1 expression marks lymphatic progenitors and lymphatic endothelial cells throughout trunk lymphatic network development (A) Diagram of a zebrafish embryo with a blue box highlighting the region shown in B-M. (B, E, H, and K) Confocal images of trunk vessels in Tg(fli1a:EGFP)y1 embryos and larvae at the stages indicated at left. (C, F, I, and L) Illustrative diagrams of the trunk vessels visualized in each of the confocal images at left. Red, arterial blood vessels (or primary intersegmental blood vessel (ISV) whose identity if as yet undetermined, in C); blue, venous blood vessels; green, prox1-positive lymphatic progenitors and developing lymphatic vessel (LV) segments. Box shows approximate area of whole-mount in situ hybridization (WISH) images at right. (D, G, J, and M) Transmitted light images of zebrafish embryos and larvae (at the stages noted at left) subjected to WISH, probing for prox1. Expression of prox1 is detected in both developing LV segments (G, J, and M) as well as in selected cells within the posterior cardinal vein (PCV) (marked with dab2-fluorescin probe, red staining) prior to emergence of lymphatic progenitors from these blood vessels (D). |
|
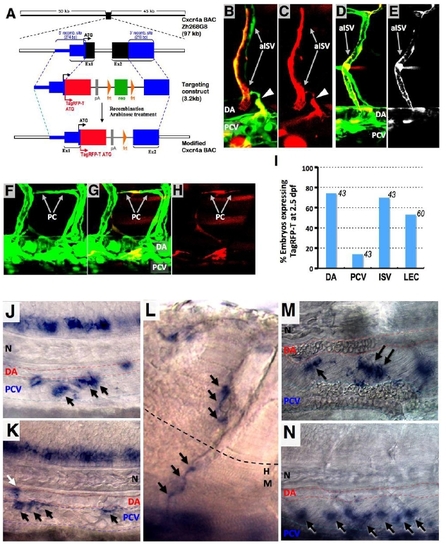
(related to Figure 2). Determination of cxcr4a expression pattern of using recombineered Cxcr4a BAC constructs. (A) Construction of a targeted BAC construct driving TagRFP-T expression from cxcr4a promoter-enhancer sequences. (B-E) Confocal images of Tg(fli1a:EGFP)y1 embryo (green) at 35 hpf (B and C) and 48 hpf (D and E) injected with a recombineered BAC clone with TagRFP-T driven by the cxcr4a promoter (red). TagRFP-T is detected in ISV, DA, and a subset of cells in PCV from which lymphatic progenitor emerges (arrowhead in B and C). (B and D) Merged image. (C and E) Red channel only. (F-H) Confocal images of 2 dpf Tg(fli1a:EGFP)y1 embryo (green) injected with a recombineered BAC clone with TagRFP-T driven by the cxcr4a promoter (red). TagRFP-T is detected in lymphatic progentor sprouting from PCV and PC. (F) Green channel only. (G) Merged image. (H) Red channel only. (I) Quantification of TagRFP-T expression domains in modified Cxcr4a BAC-injected Tg(fli1a:EGFP)y1 embryo at 2.5 dpf. Numbers above the bars show the number of TagRFP-T expressing embryos counted. (J-N) WISH images showing cxcr4b expression in various stages of Zebrafish. Cxcr4b is detected in a subset of PCV cells at 32 hpf (black arrows; J) and at 36 hpf (black arrows; K), in a sprouting lymphatic progenitor (white arrow in K), in dorsoventrally migrating lymphatic cells at 65 hpf (black arrows; L), and in lymphatic cells forming the TD at 3 dpf (black arrows; M) and 4 dpf (black arrows; N). |
|
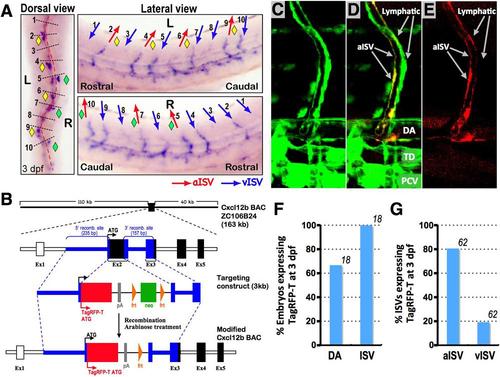
(related to Figure 3). Examining cxcl12b expression using whole-mount in situ hybridization and recombineered Cxcr12b BAC constructs. (A) Determination of the arterial-venous identity and cxcl12b expression of each trunk ISV. An example of how the presence (or absence) of cxcl12b expression in each individual intersegmental blood vessel (ISV) is assessed in an animal in which the arterial or venous identity of the same ISV has previously been determined. Transmitted light imaging is used to determine the direction of flow in each ISV, on both sides of the trunk in a 3 dpf zebrafish larvae (Movie S2; focusing up and down to visualize the vessels on either side of the trunk). Dorsal-ward flow indicates arterial (aISV) identity, ventral-wards flow indicates (vISV) venous identity. After recording the arterial or venous identity of each of the first 10 ISV on either side of the trunk, animals are fixed and each animal is separately subjected to whole-mount in situ hybridization (WISH) probing for cxcl12b. The presence or absence of cxcl12b expression in each of the ISV is then assessed blindly, examining from a dorsal (left), left lateral (top right), and right lateral (bottom right) perspective. The cxcl12b-positive ISVs are noted with yellow (left side) or green (right side) diamonds. Following determination of cxcl12b expression status, comparison is made to which vessels had previously been recorded to be aISV (red arrows in right panels) or vISV (blue arrows in right panels). The expression of cxcl12b strongly correlates with aISV rather than vISV identity. Red dashed line in dorsal view denotes the midline. (B) Construction of a targeted BAC construct driving TagRFP-T expression from cxcl12b promoter-enhancer sequences. (C-E) Confocal images of a 3.5 dpf Tg(fli1a:EGFP)y1 (green) larva injected with a recombineered BAC clone with TagRFP-T (red) driven by the cxcl12b promoter. TagRFP-T is detected in aISV, DA, but not in ISLV. (C) Green channel (EGFP) only. (D) Merged image. (E) Red channel (TagRFP-T) only. (F) Quantification of TagRFP-T expressing cell types observed in recombineered Cxcl12b BAC-injected Tg(fli1a:EGFP)y1 embryos at 3 dpf. Numbers above the bars show the number of TagRFP-T expressing embryos counted. (G) Quantification of TagRFP-T-expressing aISVs or vISV in embryos that have TagRFP-T-positive ISVs in F. Numbers above the bars show the number of TagRFP-T expressing ISVs counted. |
|
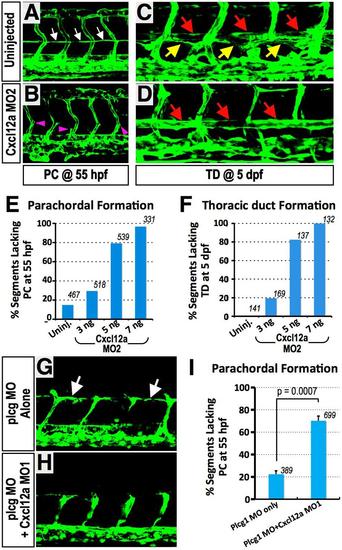
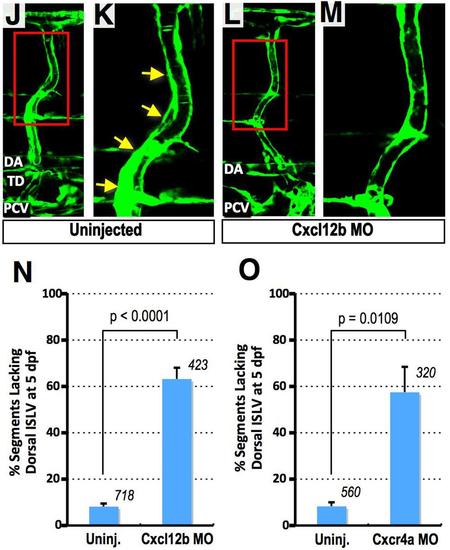
(related to Figure 4). Chemokine signaling deficiency compromises proper lymphatic network formation (A-F) Translation-blocking Cxcl12a MO (Cxcl12a MO2) results in defects of both PC and TD formation. (A and B) Confocal images of trunk vessels in 55 hpf Tg(fli-EGFP)y1 embryos that were either not injected (A), or injected with Cxcl12a MO2 (B). White arrows indicate PC. (C and D) Confocal images of trunk vessels in 5 dpf Tg(fli-EGFP)y1 embryos that were either not injected (C), or injected with Cxcl12a MO2 (D). Red, yellow arrows, and magenta arrowheads indicate DA, TD, and secondary sprouts migrating to the level of the HM, respectively. (E) Quantification of PC formation defects in 55 hpf Cxcl12a MO2-injected embryos (as shown in A and B). The total number of segments counted is shown above each bar. (F) Quantification of PC formation defects in 5 dpf Cxcl12a MO2- injected embryos (as shown in C and D). The total number of segments counted is shown above each bar. (G-I) Cxcl12a knockdown results in PC formation defects without affecting initiation and growth to the horizontal myoseptum of PCV-derived sprouts. (G) Confocal image of trunk vessels in 55 hpf Tg(fli-EGFP)y1 embryos injected with 15 ng Plcg MO. (H) Confocal image of trunk vessels in 55 hpf Tg(fli-EGFP)y1 embryos injected with 9 ng Cxcl12a MO + 15 ng Plcg MO. (I) Quantification of PC formation defect in 55 hpf MO-injected embryos (as shown in G and H). Values are the mean ± SEM. The total number of segments counted is shown above each bar. Secondary sprouts emerge from the PCV and grow to the level of the horizontal myoseptum (HM) in Plcg/Cxcr4a double MO-injected animals (H and I) but fail to form the PC (white arrows), as they do in animals injected with Plcg MO alone (G and I). (J-N) Dorsal migration of lymphatic endothelial cells from the PC is compromised in Cxcl12b-deficient embryos. (J and K) Confocal images of trunk vessels in un-injected 5 dpf Tg(fli-EGFP)y1 embryos, with magnified view of red box in J shown in K. Yellow arrows indicate an ISLV aligned along the dorsal part of an aISV. (L and M) Confocal images of trunk vessels in Cxcl12b MO-injected 5 dpf Tg(fli-EGFP)y1 embryos, with magnified view of red box in L shown in M. Note the absence of an ISLV aligned along the dorsal aISV. (N) Quantification of defects in alignment of ISLV along dorsal aISV in 5 dpf Cxcl12b MO-injected embryos (as shown in J-M). (O) Quantification of defects in alignment of ISLV along dorsal aISV in 5 dpf Cxcr4a MO-injected embryos. For N and O values are the mean ± SEM, and the total number of aISV examined for the presence of a co-aligned ISLV is shown above each bar. |
|
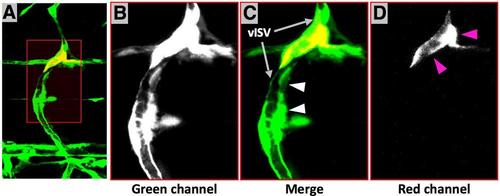
(related to Figure 6). Ectopic expression of Cxcl12b induces abnormal migration of LECs (A-D) Confocal images of trunk vessels in a 5 dpf Tg(fli-EGFP)y1 embryos expressing TagRFP-T and Cxcl12b in a subset of vISV endothelial cells. A red box in A indicates magnified area showing in B to D. (B) Green channel only. (C) Merged image. (D) Red channel only. Magenta arrowheads indicate ectopic Cxcl12b-expressing vISV endothelial cells. White arrowheads point to an adjacent ectopic vISV-aligned lymphatic segment. |
Reprinted from Developmental Cell, 22(4), Cha, Y.R., Fujita, M., Butler, M., Isogai, S., Kochhan, E., Siekmann, A.F., and Weinstein, B.M., Chemokine Signaling Directs Trunk Lymphatic Network Formation along the Preexisting Blood Vasculature, 824-836, Copyright (2012) with permission from Elsevier. Full text @ Dev. Cell

