- Title
-
Androgen receptor gene expression in the developing and adult zebrafish brain
- Authors
- Gorelick, D.A., Watson, W., and Halpern, M.E.
- Source
- Full text @ Dev. Dyn.
|
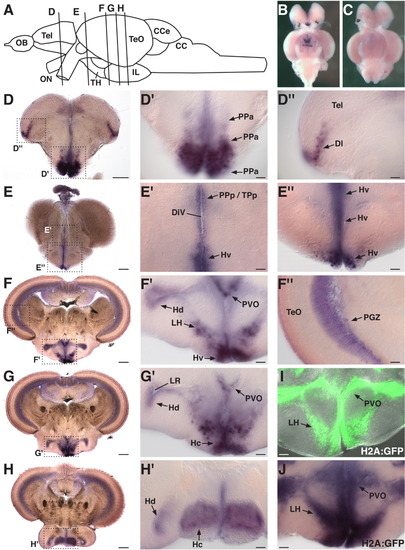
Expression of the ar gene in the adult zebrafish brain. A: Schematic of brain (modified from Wullimann et al.,[1996]), lateral view, anterior to the left, illustrating position of coronal sections shown in subsequent panels. B,C: low magnification of ventral brains hybridized with antisense (B) or sense probes (C) before sectioning. D-H: Whole brain brightfield images. Panels labeled D′, D″, E′, and so on, are high magnification differential interference contrast (DIC) images of the boxed regions from the corresponding sections. Dorsal to the top. D: Expression in the anterior parvocellular preoptic nucleus (PPa, D′) and in the lateral zone (Dl) of dorsal telencephalon (Tel, D″). E: Cells lining the diencephalic ventricle (DiV, E′), including the periventricular nucleus of posterior tuberculum (TPp) and the ventral zone of periventricular hypothalamus (Hv, E″) express ar. F-H: Expression in the periventricular gray zone of the optic tectum (PGZ, F″) and throughout the hypothalamus (F′,G′,H′). I,J: Brains from Tg(h2afv:GFP)kca66 adults were analyzed for GFP fluorescence (I) or gfp gene expression (J) to confirm that RNA probes penetrated deep regions of the hypothalamus. I, epifluorescence image overlayed onto DIC image. CC, crista cerebellaris; CCe, corpus cerebelli; Hc, caudal zone of the periventricular hypothalamus; Hd, dorsal zone of periventricular hypothalamus; IL, inferior lobe of hypothalamus; LH, lateral hypothalamus; LR, lateral recess of DiV; OB, olfactory bulb; ON, optic nerve; PVO, paraventricular organ; TeO, optic tectum; TH, tuberal hypothalamus. Panels D, F-H are of female brains, panel E are male brains. Scale bars = 200 μm in D-H, D′, D″, E′, and so on, 50 μm in I,J. EXPRESSION / LABELING:
|
|
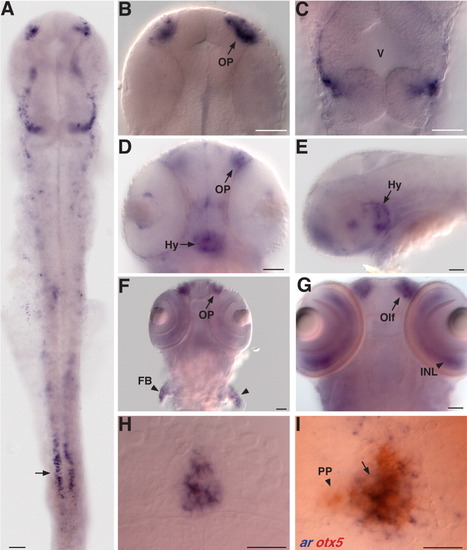
Expression of the ar gene in the embryonic brain. A: Overview of expression at 1 day (d). Arrow indicates expression in pronephros, detailed in Figure 3. B,C: Higher magnification images of expression in olfactory placodes (OP) and midbrain. V, midbrain ventricle. D,E: Expression in the presumptive hypothalamus (Hy) appears at 2 d. F: OP expression persists at 3 d and transcripts are detected in the pectoral fin buds (FB, arrowhead). G: Robust expression in the maturing olfactory organ (Olf, arrow) and the inner nuclear layer of the retina (INL, arrowhead) by 5 d. H: High magnification image of expression in the dorsal diencephalon at 3 d. I: Double-label in situ hybridization shows ar gene expression colocalizes with transcripts of otx5 (red), a gene expressed in the pineal complex (arrow). ar is not expressed in the parapineal organ (PP, arrow head). All panels are dorsal views, anterior to the top except E, lateral view, anterior to the left. Scale bars = 50 μm in A-G, 25 μm in H,I. |
|
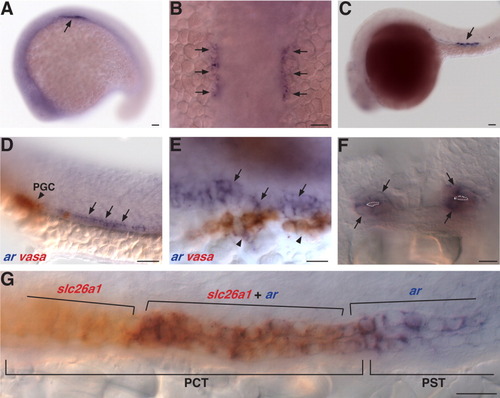
Expression of the ar gene in the embryonic pronephros. A,B: ar transcripts are detected in a bilateral row of cells (arrows) lateral to the somites at the 18 somite stage. C: ar expression is displaced posteriorly (arrow) by 24 hours (h). D,E: Double-label in situ hybridization of ar (blue, arrows) and vasa (red, arrow heads), a marker of primordial germ cells, at 24 h. E: Close association between vasa and ar expressing cells. F: Coronal section showing ar expression (arrows) in cells that form pronephric tubules at 24 h. Tubule lumen outlined in white, dorsal to the top. G: A subset of cells in the proximal convoluted tubule (PCT) express both ar (blue) and slc26a1 (red), a gene expressed in the PCT but not in the adjacent proximal straight tubule (PST), at 24 h. ar expression is also present in the presumptive PST. A,C-E,G, lateral views anterior to the left, B, dorsal view, anterior to the top. Scale bars = 50 μm in A-D, 10 μm in F, 20 μm in E,G. EXPRESSION / LABELING:
|

Unillustrated author statements |


