- Title
-
NR4A2 controls the differentiation of selective dopaminergic nuclei in the zebrafish brain
- Authors
- Blin, M., Norton, W., Bally-Cuif, L., and Vernier, P.
- Source
- Full text @ Mol. Cell Neurosci.
|
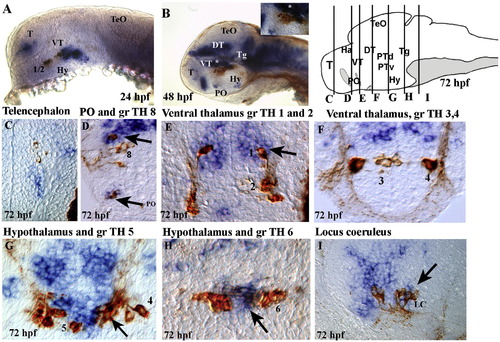
Compared expression of NR4A2a and TH during zebrafish brain development. Localization of NR4A2a transcripts obtained by in situ hybridization (blue staining) and of TH protein obtained by immunochemistry (brown). (A,B) Flat-mounted deyolked whole-mount embryos, anterior to the left, dorsal to the top, (A) lateral view of a 24 hpf embryo, (B) lateral view of a 48 hpf embryo, and focus on the posterior tuberculum and hypothalamus. (C?I) Cross sections of the brain at 72 hpf, dorsal to the top, in order along the antero-posterior axis. The brain drawing (top right panel) shows the position of the sections. Black arrows indicate cellular co-expression, and the numbers refer to TH cell groups (Rink and Wullimann, 2002). Lower magnifications of these sections are presented in SD12. EXPRESSION / LABELING:
|
|
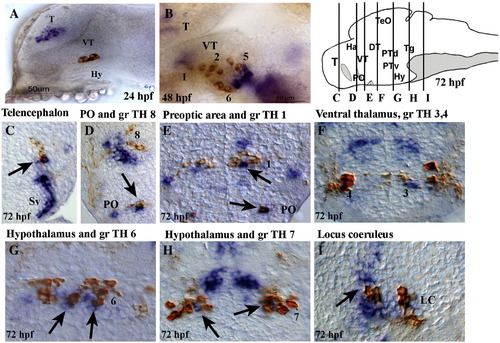
Compared expression of NR4A2b and TH during zebrafish brain development. Localization of NR4A2b transcripts obtained by in situ hybridization (blue staining) and of TH protein obtained by immunochemistry (brown). (A,B) Flat-mounted deyolked whole-mount embryos, anterior to the left, dorsal to the top, (A) lateral view of a 24 hpf embryo, (B) lateral view of a 48 hpf embryo, focus on the posterior tuberculum and hypothalamus. (C?I) Cross sections of brain at 72 hpf, dorsal to the top, in order along the antero-posterior axis. The brain drawing (top right panel) shows the position of the sections. Black arrows indicate cellular co-expression, and the numbers refer to TH cell groups (Rink and Wullimann, 2002). Lower magnifications of these sections are presented in SD13. EXPRESSION / LABELING:
|
|
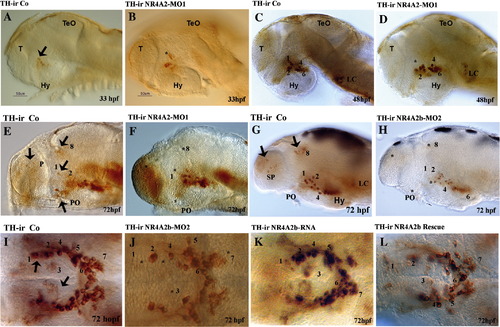
TH expression during brain development in control and morphant larvae. Whole-mount views of TH protein expression (immunocytochemistry, brown staining), for all pictures anterior is to the left, in A?H dorsal is to the top I?L are ventral views. (A, B) Lateral view of 33 hpf embryos. (C, D) Lateral view of 48 hpf embryos. (E?H) Lateral view of 72 hpf larvae. (I?L) 72 hpf larvae viewed ventrally from the hypothalamus. (*) indicate missing THir expression in morphants (compare to black arrows in control panels). EXPRESSION / LABELING:
|
|
Compared expression of NR4A2a and PCNA in the zebrafish larval brain. Double staining for NR4A2a transcripts (in situ hybridization, blue staining) and PCNA protein (immunocytochemistry, brown) in the brain at 72 hpf on paraffin sections. All views are cross-sections, dorsal to the top, in order along the antero-posterior axis as indicated on the schematic (bottom panel, see Fig. 6). Black arrows indicate cellular co-expression. EXPRESSION / LABELING:
|
|
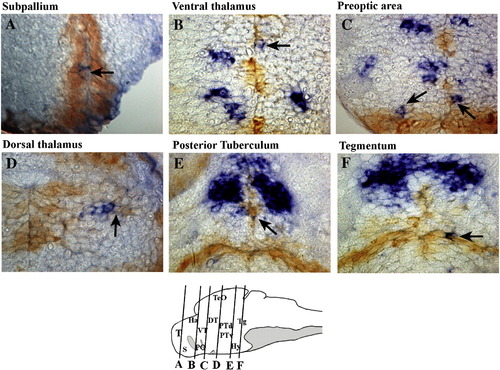
Compared expression of NR4A2b and PCNA in the zebrafish larval brain. Double staining for NR4A2b transcripts (in situ hybridization, blue staining) and PCNA protein (immunocytochemistry, brown) in the brain at 72 hpf on paraffin sections. All views are cross-sections, dorsal to the top, in order along the antero-posterior axis as indicated on the schematic (bottom panel). Black arrows indicate cellular co-expression. EXPRESSION / LABELING:
|
|
Apoptosis in TH-expressing cells in controls and morphant larvae at 72 hpf. In all panels, apoptotic cells are stained in green following TUNEL detection on control larvae (A), NR4A2-MO1-injected larvae (B,F) and NR4A2b-MO2-injected larvae (C?E). Panels E and F depict in addition a double staining for TH protein (immunocytochemistry, red). A?D are whole-mount views, anterior to the left, dorsal up; E,F are sections (planes indicated on the schematic, right panel) photographed under confocal microscopy. PHENOTYPE:
|
|
Effect of NR4A2 loss-of-function on motor behaviour and brain catecholamines in larval fish. (A,B,C) Motor activity, measured as distance swam in a 5-minute period, of uninjected, Control MO-, NR4A2-MO1- and NR4A2b-MO2-injected 5-day old (A), 12-day old (B) and 3-month old animals (C). (D) Locomotor activity, measured as distance swam in a 5-minute period, of Control MO-, NR4A2-MO1-, haloperidol-treated or not 12-day old fishes. Values are mean ± SEM. *p < 0.03 and **p < 0.003. (E,F) Monoamine determination by HPLC in head extracts from control, NR4A2-MO1- and NR4A2b-MO2-injected 12-day old larvae. (E) Dopamine level. (F) DOPAC level. |
|
NR4A2b expression during zebrafish brain development. NR4A2b expression was revealed by whole-mount in situ hybridization (blue staining) at different stages of development. For all pictures anterior is to the left; A,C,E,F,G are lateral views, dorsal is to the top; B,D,H are dorsal views. EXPRESSION / LABELING:
|
|
NR4A gene expression in morphant and control larvae. NR4A2b (A?D), NR4A3 (E?H) and NR4A1(I and J) expression was revealed by whole-mount in situ hybridization (blue staining) at 72 hpf in control and NR4A2-MO1-injected larvae. For all pictures anterior is to the left; A,B,E,F,I,J are lateral views, dorsal is to the top; C,D,G,H are dorsal views. EXPRESSION / LABELING:
|
|
Details of TH expression in control and morphant larvae. THir was obtained by whole-mount immunochemistry (brown staining) at 72 hpf on control and NR4A2b-MO2-injected larvae. For all pictures anterior is to the left; A?D and I?L are lateral views, dorsal is to the top; E?H and M?P are ventral views. Arrows point to TH-positive cells in each area where NR4A2 MO had an effect, and * indicates the disappearance of these cells in corresponding areas, after MO injections. EXPRESSION / LABELING:
|
|
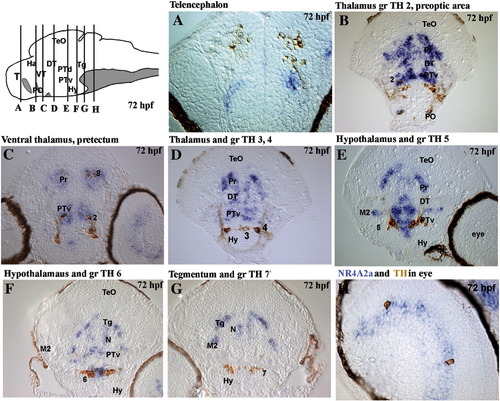
Compared expression of NR4A2a and TH during brain development. Localization of NR4A2a transcripts obtained by in situ hybridization (blue staining) and of TH protein obtained by immunochemistry (brown). All views are cross-sections of 72 hpf larvae, dorsal up, in order along the antero-posterior axis (except J: eye). The brain drawing (top left panel) shows the position of the sections. The numbers refer to TH cell groups (Rink and Wullimann, 2002). |
|
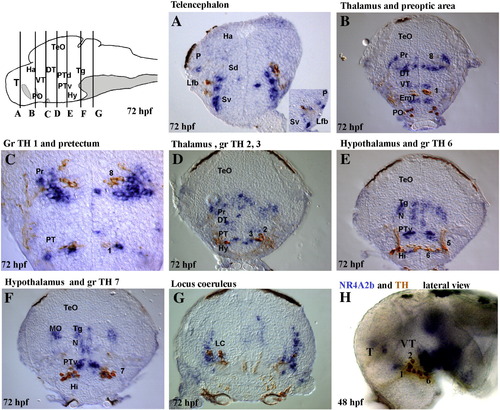
Compared expression of NR4A2b and TH during brain development. Localization of NR4A2b transcripts obtained by in situ hybridization (blue staining) and of TH protein obtained by immunochemistry (brown). A?G are cross-sections of 72 hpf larvae, dorsal up, in order along the antero-posterior axis, H is a lateral view of a 48 hpf embryo, anterior left. The brain drawing (top left panel) shows the position of the sections. The numbers refer to TH cell groups (Rink and Wullimann, 2002). |
|
Compared expression of NR4A2a and PCNA in the 72 hpf brain. Double staining for NR4A2a transcripts (in situ hybridization, blue staining) and PCNA protein (immunocytochemistry, brown) observed on parafin cross-sections, dorsal to the top, in order along the antero-posterior axis as indicated on the schematic (bottom panel). |
|
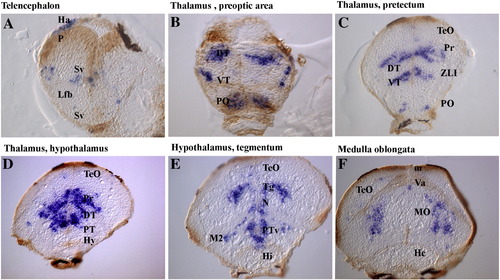
Compared expression of NR4A2b and PCNA expression in the brain at 72 hpf. Double staining for NR4A2b transcripts (in situ hybridization, blue staining) and PCNA protein (immunocytochemistry, brown) observed on parafin cross-sections, dorsal to the top, in order along the antero-posterior axis as indicated on the schematic (bottom panel). Double staining of NR4A2b and PCNA in the brain at 72 hpf on paraffin sections. (A?F) Sections of brain larvae at 72 hpf presented all along the antero-posterior axis (dorsal to the top) as indicated by brain drawing on the bottom of the panel. |
|
Compared apoptosis and TH expression in control and morphants at 72 hpf. (A?I) Double staining of THir (immunocytochemistry, red staining) and apoptotic cells (TUNEL, green staining), analyzed by scanning confocal microscopy. Sections of brain larvae at 72 hpf were obtained by confocal scanning. Merged pictures were made with by the image Image J software. (A,D,G) THir in red. (B,E,H) TUNEL staining in green. (C) Merged picture of hypothalamus of NR4A2-MO1 embryos. Merged picture of control hypothalamus (F) and telencephalon (I). TUNEL green staining in whole-mount 72 hpf control larvae(J) and NR4A2b-MO2 injected larvae (K). |
Reprinted from Molecular and cellular neurosciences, 39(4), Blin, M., Norton, W., Bally-Cuif, L., and Vernier, P., NR4A2 controls the differentiation of selective dopaminergic nuclei in the zebrafish brain, 592-604, Copyright (2008) with permission from Elsevier. Full text @ Mol. Cell Neurosci.

