- Title
-
Hhip regulates zebrafish muscle development by both sequestering Hedgehog and modulating localization of Smoothened
- Authors
- Ochi, H., Pearson, B.J., Chuang, P.T., Hammerschmidt, M., and Westerfield, M.
- Source
- Full text @ Dev. Biol.
|
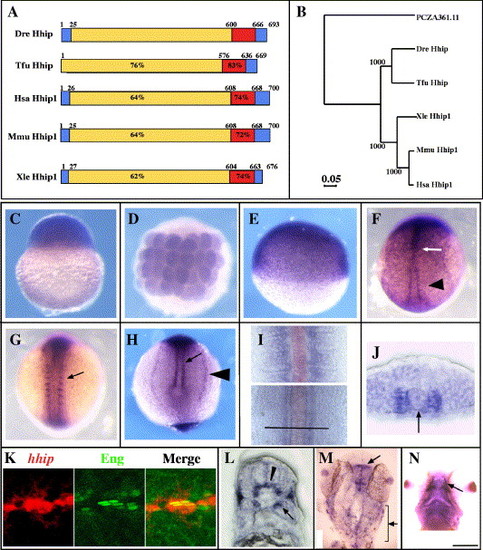
Adaxial cells, muscle pioneer and slow muscle precursors express hhip mRNA. (A, B) Zebrafish Hhip protein is closely related to Hhip in other vertebrates. (A) The predicted amino acid sequences of Danio rerio (Dre, DQ177323), Homo sapiens (Hsa, NM_022475), Mus musculus (Mmu, AF116865), Xenopus laevis (Xle, BC046952) and Takifugu rubripes (Tfu, SINFRUT00000133748) Hhip protein. Red indicates the EGF-like domains, and blue indicates the hydrophobic stretches. Percentages indicate sequence identity of amino acids of each domain compared to the zebrafish sequence. The numbers indicate the locations of borders between domains. (B) Phylogenetic tree comparing zebrafish Hhip with other vertebrate Hhip proteins. The tree is based on the amino acid sequences of putative open reading frames of the proteins aligned with the Clustal method. PCZA361.11 (CAA11769) was used as an outgroup. Numbers indicate bootstrap support for the nodes. (C) Maternal hhip mRNA is present in the one-cell stage embryo. (D, E) hhip mRNA is present throughout the embryo at 32-cell (D) and 50% epiboly (E) stages. (F) hhip is expressed at higher levels in the midline (arrow) and adaxial cells (arrowhead) at bud stage. (G, H) hhip expression is apparent in the medial somite (G, arrow), adaxial cells (H, arrow) and pronephric tissue (H, arrowhead) at the 8-somite stage. (I) Comparison of hhip (blue) and shh (red) expression at the 12-somite stage. hhip mRNA is expressed adjacent to shh expressing cells in posterior, presomitic regions (bottom) and farther lateral in anterior, segmented regions (top). Bar indicates location of section shown in panel J. (J) hhip is expressed adjacent to the notochord (arrow, notochord). (K) Muscle pioneer cells express hhip mRNA (left panel) and Eng protein (middle panel). Double labeling with 4D9 (green) anti-Eng antibody and hhip (red) shows that hhip expressing cells contain Eng protein (right panel) at 24 hpf. (L) hhip mRNA is detected in a subset of fast muscle cells (arrow) at 24 hpf. (M) hhip is expressed in the tectum (arrow) and neural crest cells (bracket) at 24 hpf. (N) hhip expression in adductor mandibulae at 48 hpf (arrow). (C, E) Lateral views; (D, F, G, M) dorsal views; (H) posterior view of the tail bud; (J, L) transverse sections, dorsal towards the top; (K) lateral view; (N) ventral view. Scale bar: (C?H, K, M, N) 200 μm; (I, J, L) 50 μm; (K) 25 μm. |
|
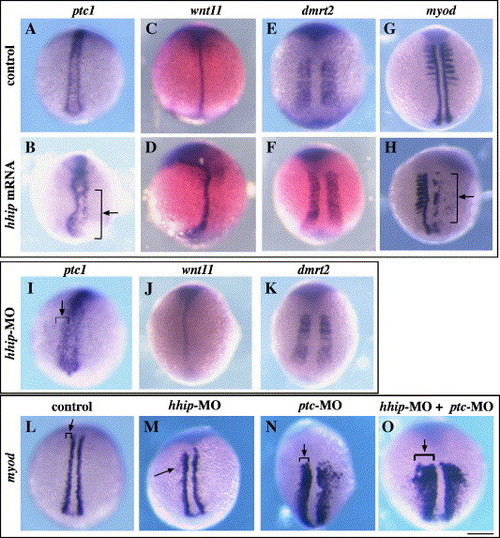
Cooperative activity of Hhip and Patched is required for restricted expression of myod in adaxial cells. (A?B) ptc1 is expressed in adaxial cells at bud stage in a control embryo (A) and is reduced by overexpression of hhip (B, arrow; 17/28 injected embryos). (C?F) In contrast, overexpression of hhip does not affect expression of wnt11, a marker of notochord, (C?D; 9/9 injected embryos) or dmrt2, a marker of paraxial mesoderm and somites (E?F, 13/14 injected embryos). (G?H) Overexpression of hhip inhibits myod expression. (G) myod is detected in adaxial cells and somites in a control embryo at the 8-somite stage. (H) myod expression is strongly reduced in a hhip mRNA-injected embryo (arrow, 25/46 injected embryos). (I?K) ptc1 expression is increased in a hhip-MO-injected embryo (I, arrow; 7/9 injected embryos). hhip-MO does not affect expression of wnt11 (J, 5/6 injected embryos) or dmrt2 (K, 11/11 injected embryos). (L?O) Reduction of Hhip and Ptc results in spread of myod expression laterally in the paraxial mesoderm. (L) Expression of myod in a control embryo. (M) Expression of myod is slightly upregulated in cells adjacent to adaxial cells in a hhip-MO-injected embryo (arrow, 23/93 injected embryos). (N) Injection of ptc-MO has a stronger effect than injection of hhip-MO (arrow, 21/27 injected embryos). (O) Reduction of both Hhip and Ptc causes a significant increase in myod expression in paraxial mesoderm (arrow, 27/27 injected embryos). Dorsal views, bud stage (A?D, I?J, L?O) and 8-somite stage (E?H, K), anterior towards the top. Scale bar: 200 μm. EXPRESSION / LABELING:
|

Combined activities of Hhip and Patched are required for muscle pioneer and slow muscle cell development. (A?M) Overexpression of hhip mRNA inhibits muscle pioneer and slow muscle development. Control embryo (A?C), hhip mRNA-injected embryo (D?F), ptc1 mRNA-injected embryo (G?I), hhip and ptc1 mRNA-injected embryo (J?L). (A, B, D, E, G, H, J, K) Transverse sections of a 24 hpf embryo labeled with slow muscle marker S58 (green), fast muscle maker zm4 (red) (A, D, G, J) and Hoechst to mark nuclei (B, E, H, K). (C, F, I, L) Embryos labeled for nuclear slow muscle cell marker Prox1 (green) and the muscle pioneer marker 4D9 (red, Eng). Both hhip and ptc1 inhibit slow muscle (D, G) and muscle pioneer development (arrows in F, I), but fast muscle cells are relatively unaffected. Simultaneous injection of hhip and ptc1 mRNAs significantly enhances the phenotypes observed in the single injection experiments (J, L). (N?D2) Loss of Hhip or Ptc increases formation of muscle pioneer and slow muscle cells. (N?Q) Control embryo. (R?U) hhip-MO-injected embryo. (V?Y) ptc-MO-injected embryo. (Z?C2) hhip-MO and ptc-MO-injected embryo. (N, O, R, S, V, W, Z, A2) Transverse sections of 24 hpf embryo labeled with slow muscle marker S58 (N, R, S, V, Z) and stained with Hoechst to label nuclei (O, S, W, A2). (P, T, X, B2) Expression of eng1a in 24 hpf embryos. (Q, U, Y, C2) Embryos labeled with Prox1 and 4D9. An expansion of the slow muscle domain was observed in hhip-MO (arrow, R), ptc-MO (V, arrow) and hhip-MO + ptc-MO (Z, arrow)-injected embryos. In situ hybridization of eng1a and double labeling with Prox1 and 4D9 demonstrates that the number of muscle pioneer cells increases in hhip-MO-injected (T, U, D2) and ptc-MO-injected (X, Y, D2) embryos. Simultaneous injection of hhip-MO and ptc-MO enhances these effects (B2, C2 D2). This enhanced phenotype is similar to that observed in shh mRNA-injected embryos (D2). (M, D′) Numbers of slow muscle and muscle pioneer cells. Averages were calculated from the total number of cells labeled by the Prox1 antibody (slow muscle) and the total number of cells labeled by both the Prox1 and 4D9 antibodies (muscle pioneer cell) counted in four somites over the extended yolk per embryo at 24 hpf in 5?10 embryos. Data represent the average ± SEM. Significance: *P < 0.01, **P < 0.05, ***P < 0.075, # no significant difference, Student′s t test. Lateral views, anterior are towards the left (C, F, I, L, P, Q, T, U, X, Y, B′, C′). Scale bar (A, B, D, E, G, H, J, K, N, O, R, S, V, W, Z, A′): 150 μm (C, F, I, L, P, Q, T, U, X, Y, B′, C′), 100 μm. |
|
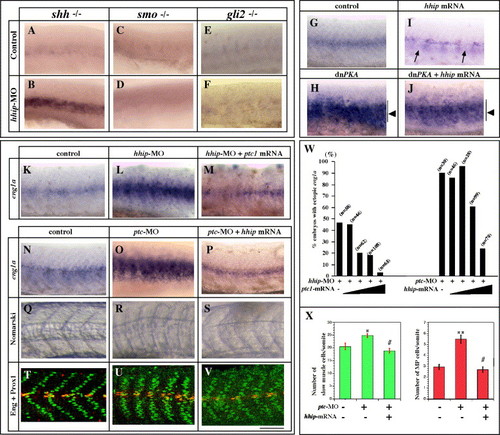
Hhip and Patched act synergistically in muscle development. (A?J) hhip acts downstream of Hh and upstream of Smo. (A, B) Injection of hhip-MO rescues eng1a expression in shh mutants. Expression of eng1a is absent in myotomes of 25% of the siblings derived from crosses between shh+/- embryos (A, n = 243). In contrast, 90% of shh mutant embryos injected with hhip-MO exhibit increased eng1a expression in the myotome (B, n = 84). (C?F) The effect of hhip-MO is suppressed in smo and gli2 mutant embryos. smo mutant embryos show no eng1a expression in the myotome (C, n = 70) and injection with hhip-MO fails to rescue eng1a expression (D, n = 69). gli2 mutant embryos show no eng1a expression (E, n = 216) and hhip-MO injection fails to rescue eng1a expression (F, n = 181). (G?J) The effect of hhip mRNA injection is suppressed by dnPKA. (G) eng1a expression in control embryo. (H) Injection of dominant negative PKA induces ectopic expression of eng1a in the myotome (arrow, 23/34 injected embryos). (I) In contrast, eng1a expression is suppressed by injection of hhip mRNA (arrow). (J) No apparent difference can be detected between dnPKA-injected embryos and embryos coinjected with hhip mRNA + dnPKA (arrow, 26/36 injected embryos). (K?X) Hhip and Ptc can replace each other. (K?M, W) Ptc1 rescues the phenotype of hhip-MO-injected embryos. eng1a expression in control (K), 3.0 μg/μl hhip-MO-injected (L) and 3.0 μg/μl hhip-MO and 100 ng/μl ptc1 mRNA-injected embryos (M). (N, Q, T) Control embryo, (O, R, U) 1.0 μg/μl ptc-MO-injected embryo, (P, S, V) 1.0 μg/μl ptc-MO and 100 ng/μl hhip mRNA-injected embryo. (N, O, W) 90% of ptc-MO-injected embryos show ectopic expression of eng1a. (P, W) The effects of ptc-MO injection are suppressed by overexpression of hhip. (Q?S) 59% of ptc-MO-injected embryos exhibit U-type somites (S). In contrast, only 36% of ptc-MO + hhip mRNA-injected embryos show U-type somites. (T?V, X) Double labeling of Prox1 and 4D9. The numbers of slow muscle and muscle pioneer cells increase in ptc-MO-injected embryos (U, X) compared to control embryos (T, X). The numbers of slow muscle and muscle pioneer cells are rescued by coinjection of hhip mRNA (V, X). (W) Percentage of embryos in which eng1a is ectopically induced in myotomes; n, number of embryos examined. Ramps indicate increasing concentrations of ptc1 mRNA (left) or hhip mRNA (right), 10, 50, 100, 200 ng/μl ptc mRNA and hhip mRNA, respectively. (X) Average numbers of slow muscle and muscle pioneer cells per somite counted in 4 somites over the yolk extension in 5?10 embryos. The data represent the average ± SEM. Significance: *P < 0.075, **P < 0.01, # no significant difference, Student′s t test. (A?V) Lateral views, anterior toward the left; scale bar: 100 μm. |
|
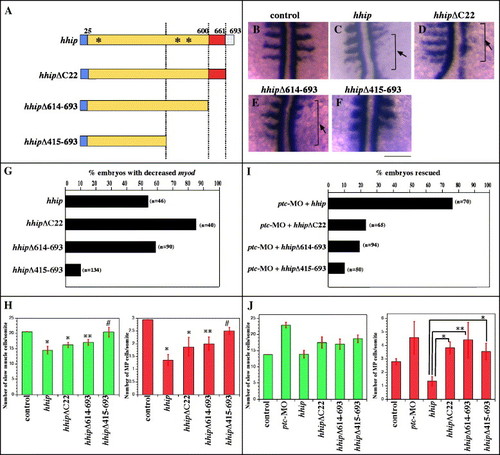
The Hhip membrane anchoring domain is required for synergistic interaction with Patched but not for negative regulation of Hedgehog. (A) Schematic of Hhip deletion mutants. Blue indicates hydrophobic region, red EGF-like domain and speckled blue the membrane anchoring domain. Asterisks indicate potential N-linked glycosylation sites. (B?H) Hhip lacking the membrane anchoring domain (D) and the EGF-like domain (E, arrow) still inhibits myod expression, whereas Hhip lacking amino acids 415?693 fails to inhibit myod expression. We scored the percentage of embryos with decreased myod at segmentation stages (G, n, total number of embryos) and the total number of cells labeled by Prox1 or both Prox1 and 4D9 at 24 hpf (H, Supplementary Fig. 3). The data represent the average ± SEM. Significance: *P < 0.01, **P < 0.05, # no significant difference, Student′s t test. (I, J) Hhip lacking the membrane anchoring domain fails to rescue ptc-MO-injected embryos. (I) ptc-MO induces ectopic eng1a expression in the myotome, and full-length hhip restores this expression (Supplementary Fig. 3). In contrast, hhipΔC22 does not suppress ectopic expression eng1a in ptc-MO-injected embryos. (J) Full-length hhip but not hhipΔC22 suppresses the number of muscle pioneer cells. The data represent the average ± SEM. Significance: *P < 0.05, **P < 0.1, Student′s t test. (B?F) Dorsal views, anterior towards the top, scale bar, 50 μm. |
|
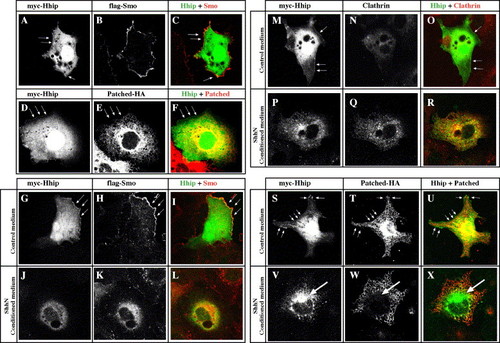
Hhip and Smoothened colocalize at the cell surface and internalize together with Clathrin in response to Hh. (A?F) Hhip and Smo, but not Ptc, colocalize at the cell surface. COS7 cells transfected with myc-Hhip, flag-Smo or Ptc-HA. (A?C) Hhip is located on the cell surface (A, arrow) and intracellularly. Intracellular Hhip localizes with Calreticulin and GM130, markers of endoplasmic reticulum and Golgi, respectively (Supplementary Fig. 4). Myc-tagged Hhip (A), Flag-tagged Smo (B) and merged image (C). (E) Ptc is located predominantly intracellularly. Myc-tagged Hhip (D), HA-tagged Ptc (E) and merged image (F). (G?X) Hhip and Smo internalize together with Clathrin in response to Hh. COS7 cells transfected with myc-Hhip, flag-Smo or Ptc-HA and then incubated for 2 h with control medium (G?I, M?O, S?U) or ShhN conditioned medium (J?L, P?R, V?X). (G?R) Hhip and Smo distribute to juxtanuclear and peripheral vesicular structures. (M?R) Ptc does not colocalize with Hhip (R, arrow). (S?X) Hhip localizes with endogenous Clathrin in ShhN-treated cells. Arrows indicate membrane associated Hhip (S). Myc-tagged Hhip (S, V), Clathrin (T, W) and merged image (U, X). (A?X) Single confocal images. |
|
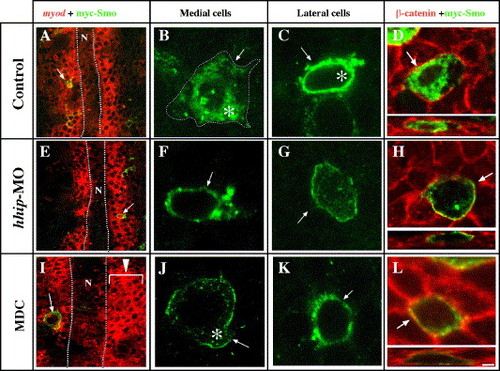
Hhip regulates Smoothened localization. (A?D) Smo is detected intracellularly (B, asterisk) and at the cell surface (B, arrow and broken line) in cells near the notochord (A, B, D, 93%, n = 16) compared with lateral cells that contain primarily intracellular Smo (C, 50%, n = 6). (E, F, G, H) hhip-MO suppresses internalization of Smo in medial cells (83%, n = 18). (I, J, K, L) Inhibition of endocytosis suppresses internalization of Smo (100%, n = 7). 100 μM MDC added at the 40% epiboly stage and then incubated to the 8-somite stage. (A?L) Embryos were injected with myc-tagged smo plasmid at the 1-cell stage and incubated to the 8-somite stage. Single confocal images of myc-tagged Smo (A?G, I, J, K and D, H, L, upper panels). Embryos were labeled with anti-myc antibody and myod (A, E, I) or anti-β-catenin antibody (D, H, L), a marker of the membrane (Nagafuchi, 2001). (D, H, L, Lower panels) Confocal micrographs (transverse z series) through myc-tagged Smo expressing cells. (A, E, I) Arrows indicate the cells shown at higher magnification in right panels. (B, C, D, F, G, H, J, K) Asterisks and arrows indicate intracellular and surface localization of Smo, respectively. N, notochord, scale bar: (A, E, I) 10 μm, (B, C, D, F, G, H, J, K, L) 2.5 μm. PHENOTYPE:
|
|
Hhip regulates muscle development. (A) Hhip functions to sequester Hh and modulate localization of Smo. Hhip together with Ptc sequesters Hh and then Hhip internalizes together with Smo into endosomes. This function allows adaxial cells to accumulate high levels of Hh while preventing movement of Hh to more lateral cells. (B) Inhibition of Hhip allows Hh activity to spread to cells lateral to adaxial cells. Increased Hh activity allows lateral cells to express myod (green, left panel) and to development subsequently into extra muscle pioneer cells and slow muscle cells (green, right panel). Left panels; dark green, cells responding to Hh. Right panels; dark green, muscle pioneer cells; green, slow muscle cells; pink; fast muscle cells. |
|
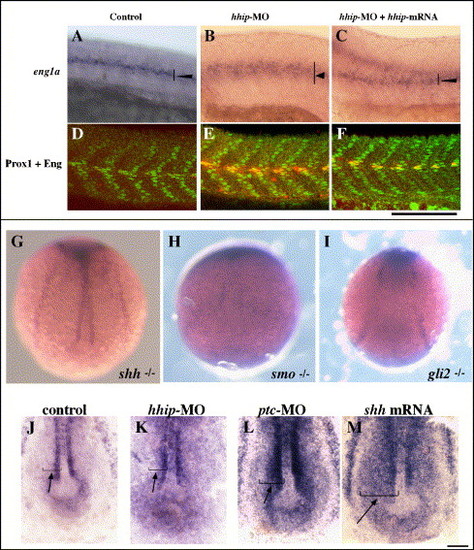
Hh signaling regulates hhip expression. (A?F) hhip mRNA suppresses the phenotypes of hhip-MO-injected embryos. (A?C) Expression of eng1a. (D?F) Embryos double labeled with anti-Prox1 and 4D9. The number of muscle pioneer cells: control, 2.0 ± 0.3; hhip-MO, 3.1 ± 0.5; hhip-MO + hhip mRNA, 1.7 ± 0.3. The number of slow muscle cells: control, 18.3 ± 2.0; hhip-MO, 12.1 ± 1.5; hhip-MO + hhip mRNA, 15.4 ± 0.3. The data represent the average number of cells ± SEM counted in 4 somites over the yolk extension. (G?M) Smo and Gli2 are required for hhip expression in adaxial cells. (G) Expression of hhip, typical or wild type, is observed in shh mutant embryos. In contrast, hhip expression is absent in offspring from crosses between smo-/+ (H, 27/67) and gli2-/+ (I, 88/262) heterozygous parents. (J?M) Increased Hh activity induces hhip expression in paraxial mesoderm. (J) Expression of hhip in control embryo. Injection of hhip-MO (K, arrow, 7/22 injected embryos) or ptc-MO (L, arrow, 26/49 injected embryos) induces ectopic expression of hhip in cells farther lateral than adaxial cells. Injection of hhip-MO induces shh mRNA (M, arrow, 27/54 injected embryos) in cells farther lateral than adaxial cells. Bud stage. Scale bar: A?F, 100 μm; G?I, 150 μm; J?M, 50 μm. |
|
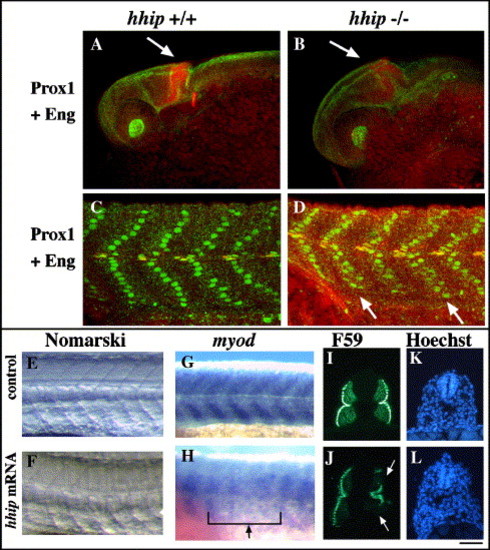
Overexpression of hhip produces U-type somites. (A?D) Muscle pioneer cells are increased in hhip mutant embryos. hhip mutant embryos show an expanded midbrain?hindbrain boundary (A, B, arrow). The number of muscle pioneer cells is increased (C, D; hhip+/+ 1.2 ± 0.6; hhip-/- 2.3 ± 0.2). Prox1 positive slow muscle nuclei assume a sharp chevron shape in wild-type embryos (C). In contrast, slow muscle nuclei are disorganized in hhip mutant embryos (D, arrows). The number of slow muscle cells: hhip+/+ 17.4 ± 1.3; hhip-/- 15.4 ± 1.1. The data represent the average number of cells ± SEM counted in 4 somites over the yolk extension. (E, F) hhip mRNA-injected embryos develop U-type somites. Mutations that disrupt Hh signaling (van Eeden et al., 1996) and injection of ptc1 mRNA are known to cause U-type somites (Lewis et al., 1999b). Consistent with this, hhip mRNA-injected embryos develop U-type somites (50%, n = 48) and some have more closely spaced eyes (data not shown), another characteristic of embryos with disrupted Hh signaling. Somites of live embryos at 24 hpf. (G, H) Reduced myod expression is observed at 24 hpf in hhip mRNA-injected embryos (D, arrow, 14/61 injected embryos). (I?L) Hhip suppresses slow muscle cell development. Slow muscle cells labeled by F59 (I, J), nuclei stained with Hoechst (K, L). Consistent with S58 labeling (Fig. 2), the number of F59 labeled cells is reduced in hhip mRNA-injected embryos (F, arrowheads). (C?H) Lateral views, anterior towards the left, dorsal toward the top. (I?L) Cross-sections. Scale bar: E?L, 50 μm. |
|
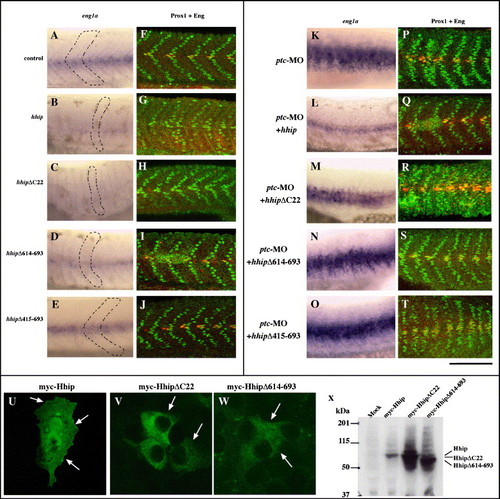
hhipΔC22 fails to suppress the phenotype of ptc-MO-injected embryos. (A?J) eng1a and Eng protein expressions are reduced in hhipΔC22-injected embryos. (A?E) Expression of eng1a. (F?J) Embryos double labeled with anti-Prox1 and 4D9. Embryos injected with hhip, hhipΔC22 and hhipΔ614?693 exhibit decreased eng1a, Prox1 and 4D9 double labeled muscle pioneer cells (B, C, D, G, H, I) and U-type somites (B, C, D, dotted line). There is no obvious difference in eng1a expression between control and hhipΔ415?693-injected embryos. (K?T) Hhip lacking the membrane anchoring domain fails to restore the phenotypes of ptc-MO-injected embryos. (K?O) Expression of eng1a. (P?T) Embryos double labeled with anti-Prox1 and 4D9. hhip suppresses ectopically induced eng1a in ptc-MO-injected embryos (L, Q). In contrast, hhipΔC22 fails to suppress ectopically induced eng1a expression (M, R). Side views, anterior to the left, dorsal to the top, 24 hpf, scale bar: A?T, 100 μm. (U?W) HhipΔC22 fails to localize to the cell surface. COS7 cells transfected with myc-tagged Hhip and then labeled with anti-myc antibody. Hhip protein is detected at the cell surface (U, arrows), whereas HhipΔC22 and HhipΔ614?693 proteins are not located on the cell surface (V, W, arrows). (X) Western blot analysis of Hhip protein. COS7 cells transfected with myc-tagged Hhip and then labeled with anti-myc antibody. EXPRESSION / LABELING:
|
|
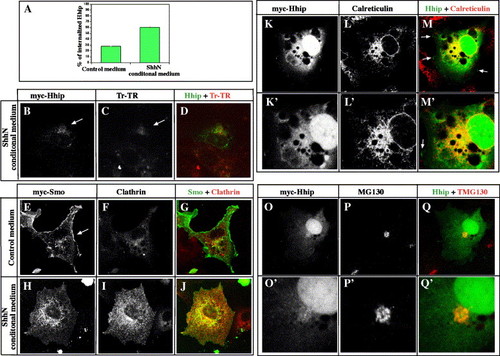
Hhip protein localizes in the endoplasmic reticulum and Golgi bodies. (A) Quantification of Hhip internalization in COS7 cells. COS7 cells transfected with Hhip. After incubation for 46 h, cells were treated with ShhN conditioned medium for 2 h. Cells were labeled for Hhip and endogenous Clathrin and then counted in 10 random areas (780 μm2) in each dish. The mean values from four independent dishes (± SEM) are shown. (B?D) Hhip internalizes in endosomes in response to Hh activity. Hhip transfected cells incubated with Transferrin?Alexa Fluor 594 conjugate (Tf?Alexa, Molecular Probes), a marker of early and recycling endosomes, for 30 min. (B) myc-tagged Hhip. (C) Tf?Alexa. (D) Merged image. (E?J) Smo internalizes with Clathrin in response to Hh. Smo transfected cells treated with control medium (E?G) or ShhN conditioned medium (H?J). Smo is located at the cell surface in control medium (E, arrow). In response to Hh, Smo internalizes and colocalizes with Clathrin, a marker of endocytic vesicles (H?J). Distribution of myc-tagged Smo (E, H) and Clathrin (F, I). (G, J) Merged images. (K?Q′) Hhip protein localizes in the endoplasmic reticulum and Golgi bodies. (K?M′) Double labeling of myc-tagged Hhip and endogenous Calreticulin, a major endoplasmic reticulum calcium binding protein (Lynch and Michalak, 2003). Hhip protein colocalizes with Calreticulin (M, M′). Arrows indicate membrane localized Hhip (M, M′). (K′?M′) Magnified views of cells shown in K?M. (O?Q′) Double labeling of Hhip and endogenous GM130, a marker for Golgi bodies (Barr and Short, 2003). GM130 functions as a structural element of the Golgi apparatus and also provides attachment sites for membranes and other Golgi proteins. (O′?Q′) Magnified views of cells shown in O?Q. (B?Q′) Single confocal images. |
|
Inhibition of endocytosis induces slow muscle cell development. (A?F) Internalization of Hhip is suppressed by MDC in COS7 cells. COS7 cells were transfected with myc-tagged Hhip and then incubated with MDC for 30 min. Cells were labeled with anti-myc antibody and anti-β-catenin antibody. Hhip protein is distributed both intracellularly (A) and at the cell surface (B, C arrow). In contrast, Hhip protein is primarily detected at the cell surface after MDC treatment (D?F). (G?N) MDC mimics the phenotype of hhip-MO-injected embryos. Embryos were treated with 200 μM MDC from 40% epiboly to 24 hpf then labeled with Prox1 (green) and 4D9 (red). (H) The number of muscle pioneers increases in embryos treated with endocytosis inhibitor (H, arrow). Numbers of muscle pioneer cells: DMSO-treated embryos, 2.6 ± 0.16; MDC-treated embryos, 3.7 ± 0.38 (G). The data represent the average number of cells ± SEM counted in 4 somites over the yolk extension. Significance: P < 0.05, Student′s t test. (I?J) Transverse sections of 24 hpf embryos labeled with S58 (I, J) and stained with Hoechst for nuclei (K, L). Dorsal to the top. (M, N) Inhibition of endocytosis increases expression of nkx2.2. Embryos were treated with 200 μM MDC from 40% epiboly stage to 24 hpf. The nkx2.2 expression domain is expanded in MDC-treated embryos (N; 83%, n = 12) compared to controls (M, n = 8). Scale bar: (G?L) 50 μm, (M, N) 100 μm. EXPRESSION / LABELING:
|
Reprinted from Developmental Biology, 297(1), Ochi, H., Pearson, B.J., Chuang, P.T., Hammerschmidt, M., and Westerfield, M., Hhip regulates zebrafish muscle development by both sequestering Hedgehog and modulating localization of Smoothened, 127-140, Copyright (2006) with permission from Elsevier. Full text @ Dev. Biol.

