
|
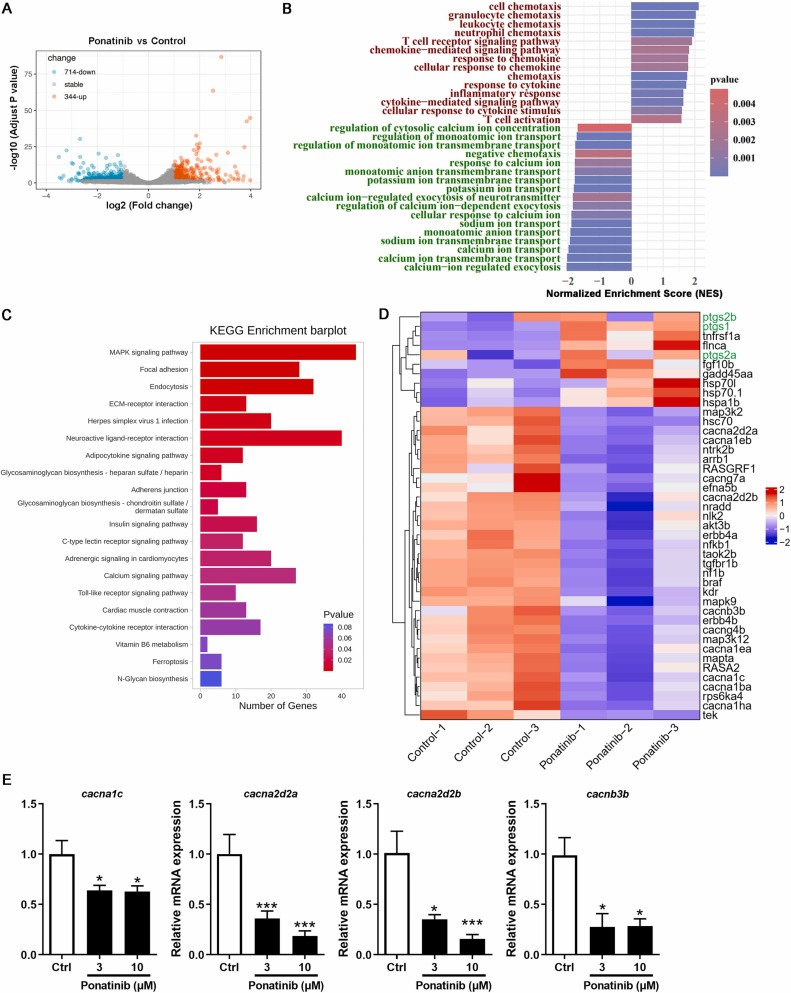
Fig. 4 The effects of Ponatinib on transcriptome in zebrafish larvae. (A) 1 dpf zebrafish larvae were treated with 0.1 % DMSO or 3 ?M Ponatinib for 3 days. RNA sequencing was performed to identify the changes in gene expression. A volcano plot representing the expression level for each gene. Block dots represent no significant DEGs between control and Ponatinib groups. Red and blue dots represent up- and down-regulated genes, respectively. (B) The enriched gene sets based on GO pathways. (C) The enriched gene sets based on KEGG pathways. (D) Heat map representing 43 gene expression changes related to COX and MAPK signaling pathway. (E) 1 dpf zebrafish larvae were treated with 0.1 % DMSO or indicated concentrations of Ponatinib for 3 days. The mRNA levels of all L-type calcium channels-related genes in 4 dpf zebrafish were determined by RT-qPCR. Data are represented as mean � SEM. *P < 0.05 and ***P < 0.005 vs. control group.