IMAGE

Figure 1

ID
ZDB-IMAGE-241115-111
Genes
Source
Figures for Zhao et al., 2024
Image
Figure Caption

Figure 1

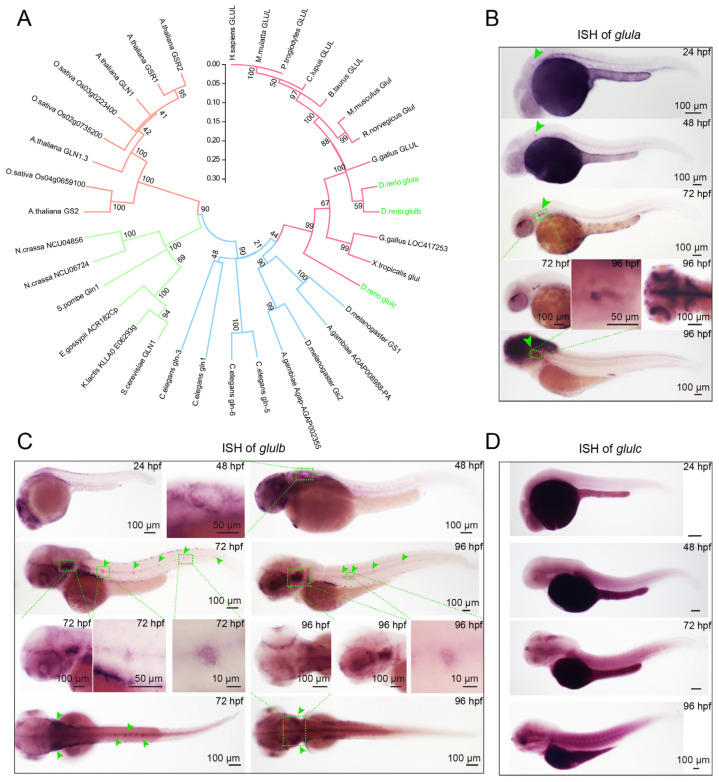
Phylogenetic analysis of Glul across diverse species and the expression patterns of the Glul gene family in zebrafish. (A) The MEGA software (Version 11.0.13) was utilized to construct a phylogenetic tree based on amino acid sequences, encompassing a diverse range of species including H. sapiens, P. troglodytes, M. mulatta, C. lupus, B. taurus, M. musculus, R. norvegicus, G. gallus, D. rerio, D. melanogaster, A. gambiae, C. elegans, S. cerevisiae, K. lactis, E. gossypii, S. pombe, N. crassa, A. thaliana, O. sativa, and X. tropicalis. Branches of the same color are closer. Whole-mount in situ hybridization (WISH) was performed using glula, glulb, and glulc probes in wild-type zebrafish. (B) The results demonstrated that the expression of the glula gene was observed specifically in the otic vesicle. Green arrowheads indicate otic vesicle. Boxes indicate the magnified regions. (C) while the glulb gene exhibited expression in both the otic vesicle and lateral line. Green arrowheads indicate otic vesicle and neuromasts. Boxes indicate the magnified regions. (D) Conversely, no significant signal was detected for the glulc gene.

Figure Data
Acknowledgments
This image is the copyrighted work of the attributed author or publisher, and ZFIN has permission only to display this image to its users. Additional permissions should be obtained from the applicable author or publisher of the image. Full text @ Int. J. Mol. Sci.