
Fig. 3
|
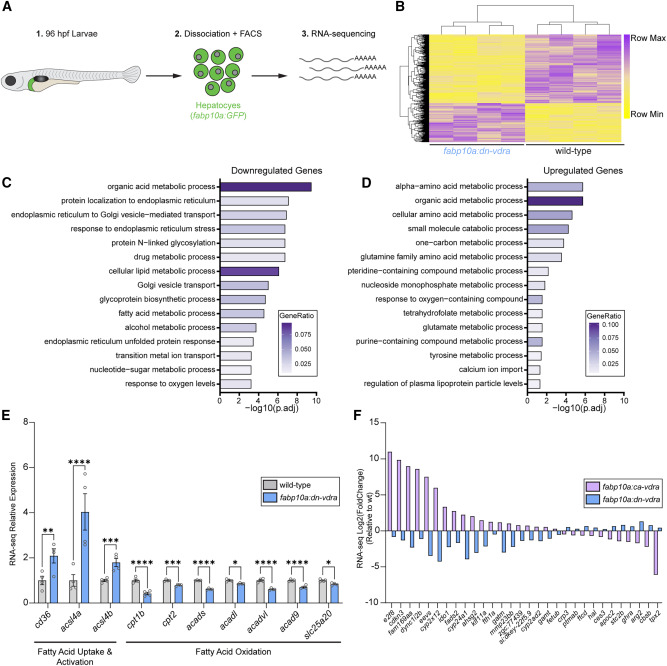
Fig. 3 Hepatocyte VDR transcriptionally promotes lipid storage over fatty acid oxidation (A) Schematic of the RNA sequencing approach for fabp10a:GFP hepatocytes collected at 96 hpf. (B) Heatmap of normalized counts of differentially expressed genes in 96-hpf fabp10a:dn-vdra hepatocytes compared to the WT. Wald test with false discovery rate correction (adjusted p value [padj] < 0.05). Each sample represents hepatocytes from approximately 35 larvae. n = 4 per group. (C and D) ClusterProfiler overrepresentation analysis of downregulated (C) and upregulated (D) genes identified by RNA sequencing. GeneRatio is the fraction of differentially expressed genes that belong to a given gene set divided by the total number of genes belonging to that gene set. (E) RNA sequencing relative expression values for genes involved in fatty acid uptake/activation and oxidation that are altered in fabp10a:dn-vdra hepatocytes. Wald test with false discovery rate correction. Adjusted p values are indicated. n = 4 per group. Error bars are mean + SEM. (F) Plot of RNA sequencing log2(FoldChange) for genes that are differentially expressed in opposite directions in fabp10a:dn-vdra and fabp10a:ca-vdra hepatocytes relative to the WT (padj < 0.05). Error bars are mean + SEM. ∗p < 0.05, ∗∗p < 0.01, ∗∗∗p < 0.001, ∗∗∗∗p < 0.0001. See also Figure S3 .