Fig. 6
Fig. 6
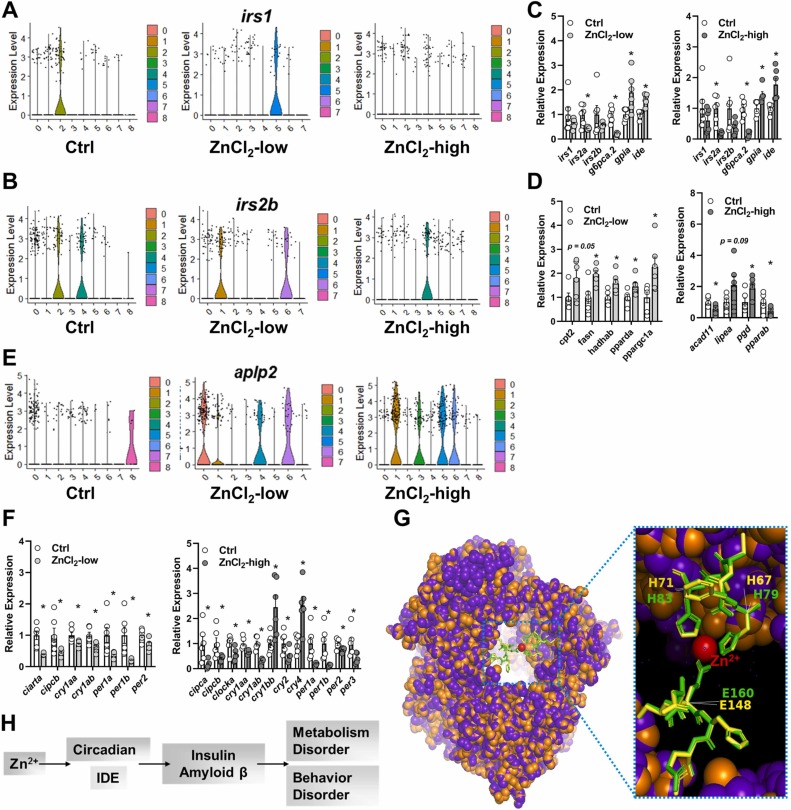
Fig. 6. Transcriptional signature of genes related to circadian and metabolic functions in the brain and liver. Signature DEGs associated with insulin functions in the brain (A and B) and liver (C); signature DEGs associated with lipid metabolism in the liver (D); signature DEGs associated with neurodegenerative diseases (aplp2, amyloid beta precursor like protein, E) signature DEGs associated with circadian rhythm in the liver (F); alignment of zebrafish IDE (purple) with human IDE (orange) with the zinc binding pockets shown (zebrafish: yellow; human: green, G); a potential functional integration of circadian and metabolism signatures between the liver and brain (H). In figure G, the SWISS-MODEL of zebrafish IDE to human IDE (PDB ID: 2JG4.1) was used as template.

