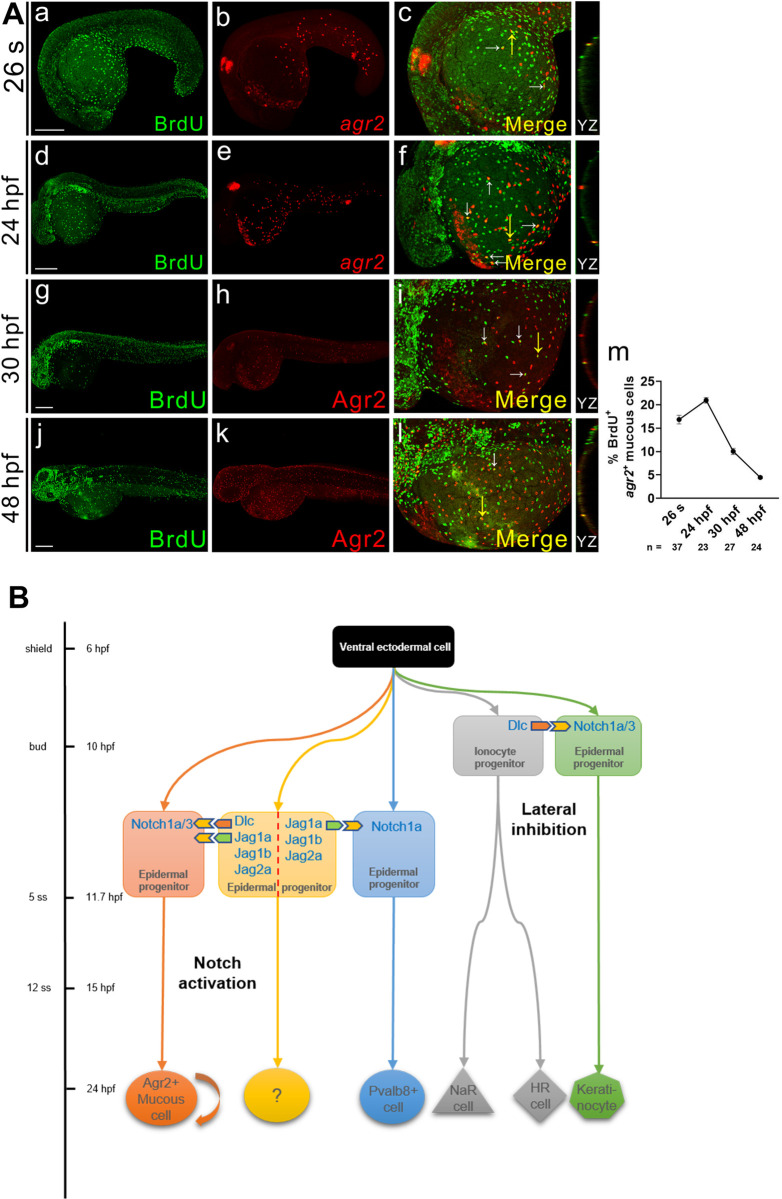
Fig 6 agr2+ EMC population is maintained by proliferation.(A). Double immunofluorescence and in situ hybridization or double immunofluorescence reveals colocalization of BrdU (green) and agr2/Agr2 (red) in the yolks of embryos at 26 s, 24, 30 and 48 hpf. BrdU labeling assay revealed that agr2+ EMCs proliferate after differentiation. The highest proliferation rate was detected at 24 hpf. White arrows indicate BrdU+agr2+ EMCs. Yellow arrows indicate positions of YZ projections of confocal images. Mean ± SEM. Scale bars, 100 μm. (B). A model depicts the timing at which sequential specification of ionocytes/keratinocytes and agr2+ EMCs/pvalb8-positive cells occurring in zebrafish embryos. The previously-explored specification of ionocytes and keratinocytes via Dlc-mediated Notch1a/3 lateral inhibition occurs at late gastrulation stage, while the newly-identified induction of agr2+ EMCs by Dlc and Jag1a/1b/2a-mediated activation of Notch1a/3 signaling and the induction of pvalb8-positive cells via Jag1a/Jag1b/Jag2a-mediated activation of Notch1a signaling occur during segmentation stage. Underlying data are available in S1 Data.
Image
Figure Caption
Figure Data
Acknowledgments
This image is the copyrighted work of the attributed author or publisher, and
ZFIN has permission only to display this image to its users.
Additional permissions should be obtained from the applicable author or publisher of the image.
Full text @ PLoS Genet.

