
Fig. 4
|
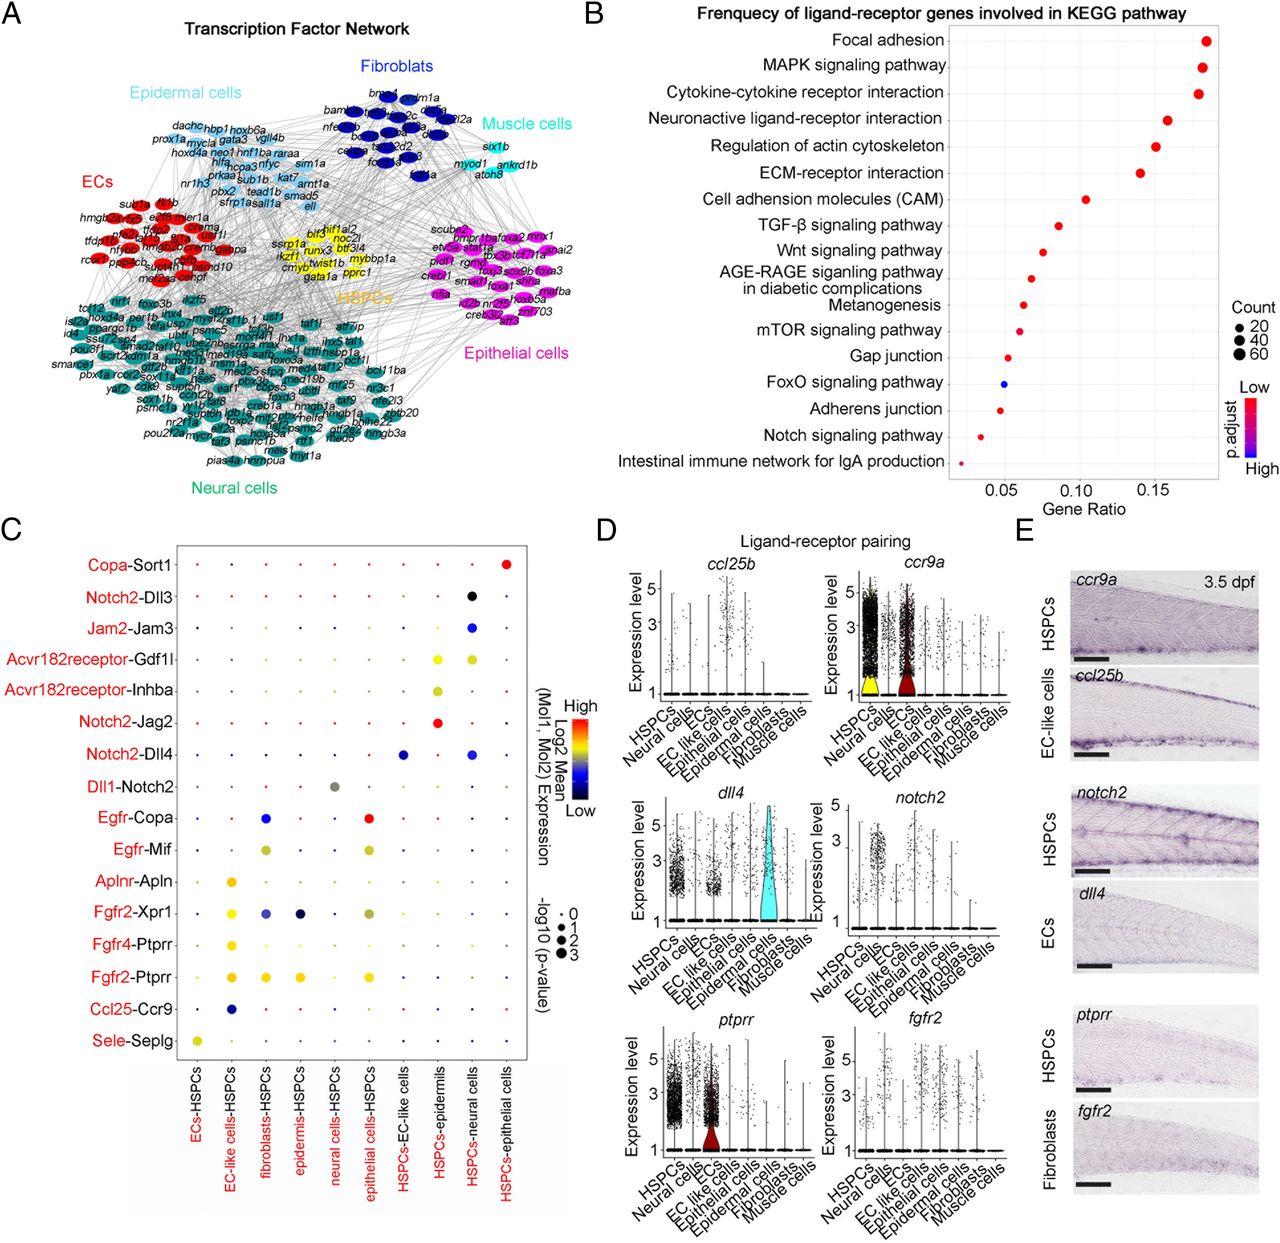
Fig. 4 Cell?cell interaction network between HSPCs and nonhematopoietic niche components. (A) The interaction network of TFs of each component. All differentially expressed TFs in each cell type are used to construct network; nodes (TFs) with more than one edge are shown. (B) Dot plot showing the frequency of ligand?receptor genes involved in Kyoto Encyclopedia of Genes and Genomes pathways. (C) Dot plot showing the ligand (red)?receptor (black) pairs between HSPCs and ECs, EC-like cells, fibroblasts, neural cells, epidermal cells, and epithelial cells. (D) Violin plot showing the normalized expression of the ligand and its receptor genes in HSPCs and ECs, fibroblasts, neural cells, spinal cord cells, epidermis, and epithelial cells for each indicated pairing. (E) WISH indicating the expression patterns of ccr9a, notch2, and ptprr in HSPCs, ccl25b and dll4 in ECs, and fgfr2 in fibroblasts at 3.5 dpf. (Scale bar, 100 ?m.)