IMAGE

Fig. 1

ID
ZDB-IMAGE-191230-1531
Genes
Source
Figures for Xiao et al., 2019
Image
Figure Caption

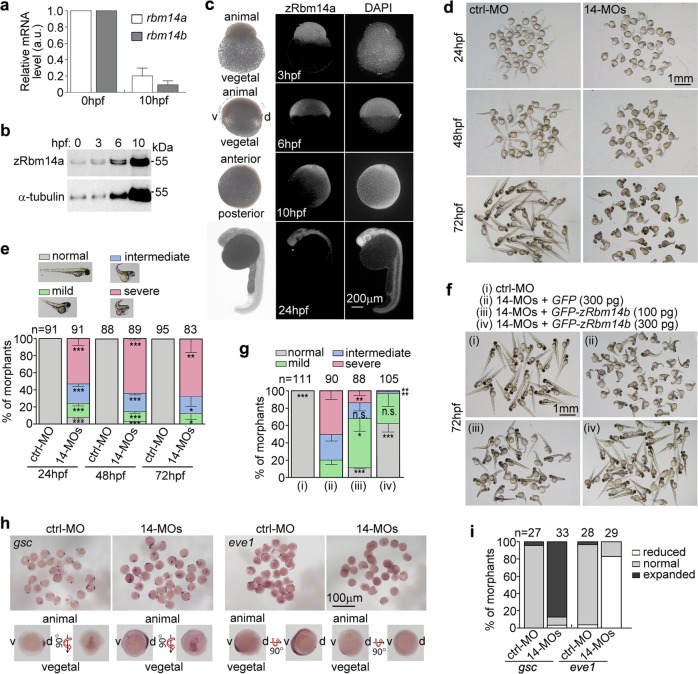
Fig. 1 Zebrafish <italic>rbm14</italic> morphants display dorsalized phenotypes.

arbm14 was downregulated during embryogenesis. Total mRNAs were extracted from 50 zebrafish embryos at 0 or 10 hpf. The expression levels of rbm14a and rbm14b were analyzed by qPCR. β-Actin was used as internal control. qPCR results from two independent experiments are presented as mean ± SD. b Total protein levels of zRbm14a increased during early embryonic development. Zebrafish embryos at the indicated stages were removed of the yolk and subjected to immunoblotting. Proteins from 8 embryos were loaded in each lane. c Immunofluorescent staining of zRbm14 in zebrafish embryos. Nuclear DNA was stained by DAPI. The animal and vegetal poles and ventral (v) and dorsal (d) sides are marked in the bright-field images. d Embryo morphologies at the indicated developmental stages. Zebrafish embryos at the one-cell stage were injected with a control morpholino oligonucleotide (ctrl-MO; 8 ng per embryo) or two MOs specific to rbm14a and rbm14b, respectively (14-MOs; 4 ng each per embryo) (see Supplementary Fig. 2a–e). e Quantification results for the experiments in d, based on the criteria and examples shown. f, g Exogenous zRbm14b rescued the dorsalized phenotypes. Zebrafish embryos at the one-cell stage were co-injected with the indicated MOs (total 8 ng per embryo) and in vitro-transcribed mRNA (also see Supplementary Fig. 1f). The morphants were examined at 72 hpf. Those injected with ctrl-MO served as negative control. Data in e and g, presented as mean ± SD, were from three independent experiments. Student’s t-test against the ctrl-MO-injected populations: n.s., no significance (P > 0.05); *P < 0.05; **P < 0.01; ***P < 0.001. Total numbers of embryos analyzed are listed over histograms. h, i The rbm14 morphants show defective dorsoventral patterning. Zebrafish embryos microinjected as in d were subjected to mRNA in situ hybridization at the 75–90% epiboly stages (h) and quantified (i). Total numbers of embryos analyzed are listed over each histogram

Figure Data
Acknowledgments
This image is the copyrighted work of the attributed author or publisher, and ZFIN has permission only to display this image to its users. Additional permissions should be obtained from the applicable author or publisher of the image. Full text @ Cell Discov