IMAGE

Fig. 7.

ID
ZDB-IMAGE-190723-2595
Source
Figures for Hu et al., 2019
Image
Figure Caption

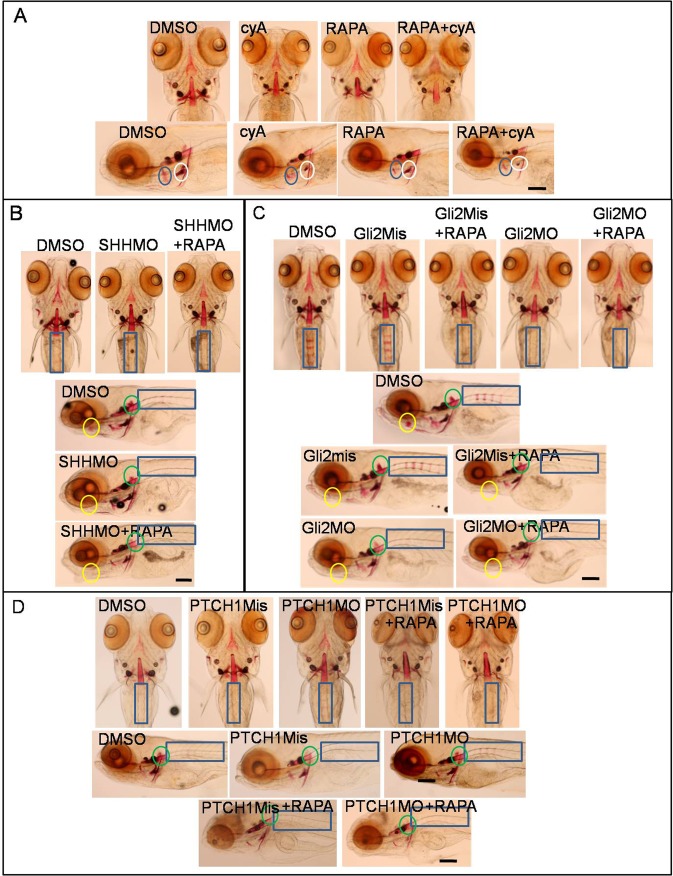
Fig. 7.

Autophagy inducer RAPA and block of Hh signaling co-inhibited osteoblast mineralization. (A) Larvae at 3 dpf were exposed to 10 µM cyA, 10 µM RAPA or cyA plus RAPA, with larvae collected for Alizarin Red staining at 6 dpf. Blue circle, op; white circle, cb. (B–D) Embryos were injected with 50 µM SHHMO, Gli2MO, Gli2Mis, PTCH1MO and PTCH1Mis at the 1–4 cell stage, DMSO control group and injected group larvae were treated with 10 µM RAPA, with larvae collected at 6 dpf for Alizarin Red staining. Yellow circle, bop; green circle, hm; blue rectangle, rib. Scale bars: 50 µm.

Acknowledgments
This image is the copyrighted work of the attributed author or publisher, and ZFIN has permission only to display this image to its users. Additional permissions should be obtained from the applicable author or publisher of the image. Full text @ Biol. Open