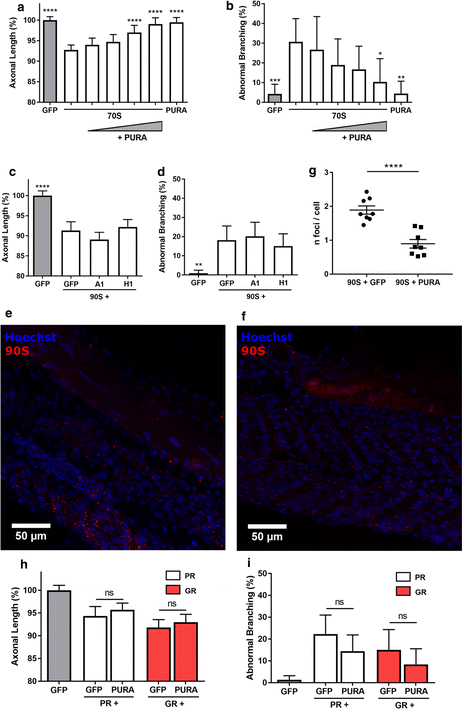
Fig. 5
Pur-alpha prevents repeat induced axonopathy in the zebrafish. a, b Dose-dependent effect of injection of Pur-alpha mRNA (0.072–0.143–0.287–0.573 µM) on ~ 70S (0.844 µM) axonal toxicity, statistics are compared to the second condition, i.e., 70S (n = 3 experiments). a Data represent mean ± 95% CI one-way ANOVA, F(6, 310) = 21.56, ****p < 0.0001. b Data represent mean ± 95% CI logistic regression (z values − 3.516, − 0.393, − 1.272, − 1.594, − 2.007, − 2.909), *p < 0.05, **p < 0.01, ***p < 0.001. c, d Effect of hnRNPA1 (‘A1’; 0.108 µM) and hnRNPH1 (‘H1’; 0.030 µM) on ~ 90S (0.844 µM) axonal toxicity, statistics are compared to the second condition, i.e., 90S + GFP (n = 8 experiments). c Data represent mean ± 95% CI one-way ANOVA, F(3, 460) = 29.63, ****p < 0.0001. d Data represent mean ± 95% CI logistic regression (z values − 3.157, 0.393, − 0.624), **p < 0.01. e, f Whole-mount staining (Hoechst) of 30 hpf zebrafish embryos injected with fluorescently labeled ~ 90S repeat RNA together with GFP (e) or Pur-alpha (f) Mrna, respectively. g Quantification of number of RNA foci per cell in conditions of panel e and f, n = 8 embryos, data represent mean ± SEM, unpaired t test (t14 = 5.677), ****p < 0.0001. h, i Effect of Pur-alpha (0.573 µM) on PR and GR (0.844 µM) axonal toxicity (n = 6 experiments). h Data represent mean ± 95% CI one-way ANOVA, F(4, 444) = 18.49, (PR + GFP vs PR + Pur-alpha: p = 0.7575; GR + GFP vs GR + Pur-alpha: p = 0.9235). i Data represent mean ± 95% CI logistic regression (PR + GFP vs PR + Pur-alpha: z value = − 1.340, p = 0.18; GR + GFP vs GR + Pur-alpha: z value = − 1.123, p = 0.261)

