Fig. 4
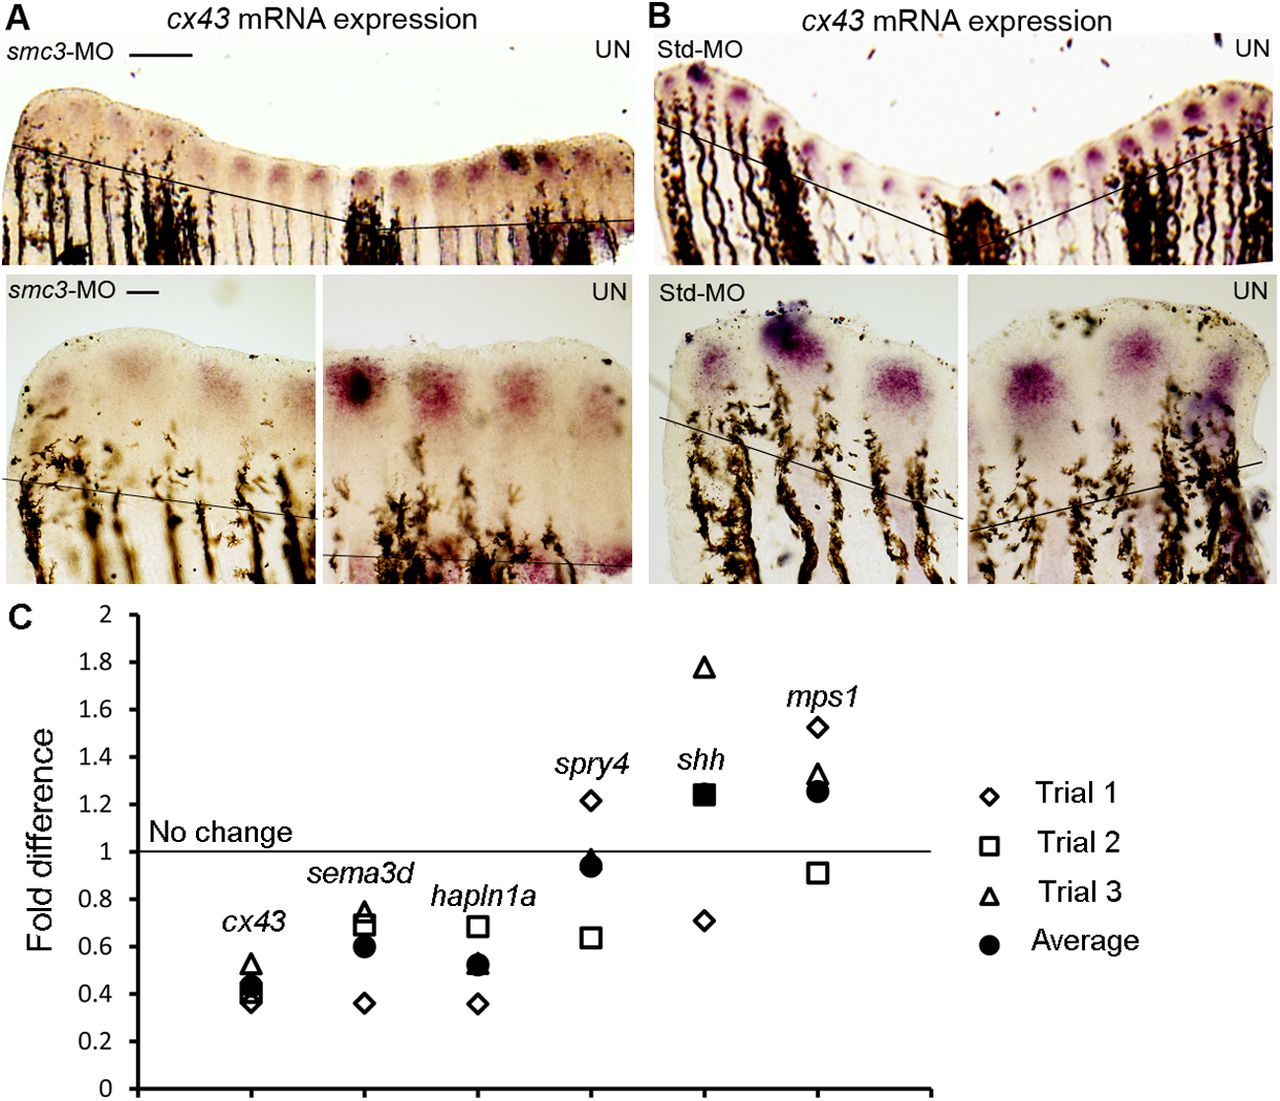
smc3 regulates the expression of cx43 in regenerating fins. (A) Representative image of a fin with the smc3-knockdown side (smc3-MO) showing decreased cx43 staining compared to the uninjected side (UN). Higher magnification of the smc3 knockdown side of the same fin shows reduced levels of cx43 expression compared to the uninjected side), which shows normal cx43 levels. (B) Representative image of Std-MO-injected fin revealing similar cx43 levels in both injected and uninjected sides. Higher magnification of the same fin shows normal and similar levels of cx43 expression in both injected and uninjected sides (UN). For this experiment n=6 fins per trial and three independent trials were performed. The solid line indicates the amputation plane. Scale bars: 100 µm in the upper panel; 50 µm in the lower panel. (C) qPCR confirms the downregulation of cx43 and cx43-dependent target genes (sema3d and hapln1a) following Smc3 knockdown. Fold difference values from the qPCR are shown; a fold difference of 1 is considered as no change with respect to Std-MO-injected fins (indicated by the horizontal line). Three independent Smc3 knockdown samples were prepared. Each sample was tested in duplicates (trials 1-3) for cx43, hapln1a, sema3d, shh, spry4 and mps1 (compared to the internal reference gene, actin). Each of the three trials are denoted by open shapes and the averages are denoted by solid circles.

